Components, structure and why they matter
Tips on structuring your project for automation, clarity, and reproducibility
The purpose of this guide is on clarifying why you should care about structure and automation when it comes to initial setup and use of your research compendium as you are expanding it during your research. It also outlines the target structure and lists the key sub-objects that are typically present.
While structure is a slightly more advanced topic (we see structure as silver level and automation as gold), we think that considering the design at the beginning and a bit of discipline throughout adds great value to yourself and to others! You will indeed thank yourself later!
What structure do you need?
Overview
In a nutshell, as a compendium is shared alongside the published paper that includes all research objects necessary to reproduce the research, it is key to ensure the structure is logical and intuitive. We can visualize the structure in two ways – visually (see Figure 1) or through a directory structure.

price-index-pipeline/
├── data/
│   ├── raw/                # READ ONLY raw input data
│   └── processed/          # Processed data ready for analysis
│
├── functions/              # Code that processes and analysis the data
│   ├── process_data.R      # Process the raw data to prepare it for analysis
│   └── index_utils.R       # Functions used in the analysis step (keeps heavy)
│                           #  processing out of the paper.qmd
│
├── output/                 # Generated data and artifacts
│   ├── figures/            # Figures embedded into the paper
│   └── tables/             # Output data
│
├── docs/                   # Project documentation/paper
│   ├── paper.qmd           # The main manuscript (imports data, runs analysis).
│   ├── references.bib      # Bibliography.
│   └── charter.md          # Project charter (and other project management materials)
│
├── _quarto.yml             # Project configuration (if you use Quarto)
├── README.md               # The "Home Page" for the compendium
├── LICENSE                 # CC-BY (text/media) and MIT (code).
├── renv.lock               # The "Time Capsule" for the computational evironment
├── .gitignore              # Specify which files should not be versioned controlled
└── makefile                # Automate the end-to-end workflow
A little about each aspect
A data folder that outlines where to store the raw (input) dataset used for the research project. Ideally the researcher uses an open dataset (which will make the whole process reproducible), but they may also use a proprietary dataset.
The dataset that acts as the main input dataset to the research should not be version controlled. The folder is created in order to ensure that when a local copy of the compendium is used by researchers, they know where to put the data to ensure that the code will replicate the results in full.
Technically, this means making sure that the .gitignore skips this data file
A folder for functions (or other code) that helps process your data into the relevant outputs. This could include the code to clean and prepare the raw dataset for research purposes, the code to create the processing and research experiments, as well as notebooks where the data is explored and various aspects that feed the research paper are generated. Note this is sometimes also called /src/ or /R/ folder.
A folder for the output data. This data can be versioned (if it is not sensitive) with the repository and allows researchers to replicate the process. Note, if the output data can be used for research in its own right, it may be appropriate to register this dataset on a public repository (such as Zenodo) that mints a DOI.
A folder for documentation to that explain key aspects of the research. This folder stores project documentation or the project design, code documention, as well as the source code for the paper.
A license. This will tell users how they can use the code.
A .gitignore file. There are some files and folders that should not be version controlled. Notable example is datasets
A file to recreate the computational environment on which the code will run identically. A shift in one package version to another may change the output, hence its key to track exactly how to replicate the same environment and get the same result.
An orchestrator of all the steps to automate the data cleaning, processing, and analysis steps that results in the final paper. Options like make, pre-render in Quarto, or dvc are some notable examples. This helps ensure that you don’t have to remember the order of scripts in the /functions folder.
Finally, a README to introduce the project. This will be the landing place when someone navigates to the repository, hence it should describe the project at a glance.
The Why
Why use a standard directory structure?
As outlined above, a structured approach is at a minimum organized and clear. Anyone can:
- The input data goes in the
/data/folder. - The preprocessing scripts in
/functions/processing.pyconvert the raw data into processed data. - Analysis in
/functions/analysis.pyoutput data and images that can be embedded directly in the paper.
In other words, the research becomes very clear and the value added is the contribution, with a lower cognitive load placed on anyone (including yourself at a later date) trying to understand it.
What happens if you don’t make the structure explicit but keep it implicit?
When you come to it fresh (either it is new for you or you are coming back to your own material much later), you waste time trying to get into the context.
The implicit structure (by nature of being implicit) is likely to be messier than if it was well thought through, hence it’s more likely to be harder to extend the research,
The cognitive burden placed on the prerequisite of understanding something not clearly structured means it’s less likely to be material you learn from. In other words, fewer people will review, evaluate or try what you are doing—meaning that your contribution stays in the generalizable category.
Why take the effort of avoiding manual steps?
Further to structuring your project, avoiding manual steps (especially manipulation of spreadsheets!!) is key. If you’ve ever read a paper where preprocessing was described in a few short and unclear sentences which made it nearly impossible to reproduce the process without contacting the researcher—you can probably see what we mean!
So what to do instead?
Ensure all steps can be executed through code (and version control this code with the repository). In other words, make sure there are no manual steps. This also means that you should version control all code, including the data preprocessing code.2
Structure the steps to follow a clear order of operations and use a specific folder structure for code and data that is processed along the way.
Test the automation to ensure that anyone (including yourself at a later time) can process the same outputs with the same raw data.
If you’re up for it, you could even automate the rendering of the analysis paper, such as through the manuscripts feature of Quarto.
For instance Figure 2 shows visually how a
.qmdfile and some notebooks in the repository can be automated to generate the final analysis paper.Using make or dvc are other examples of tools to automate the process.
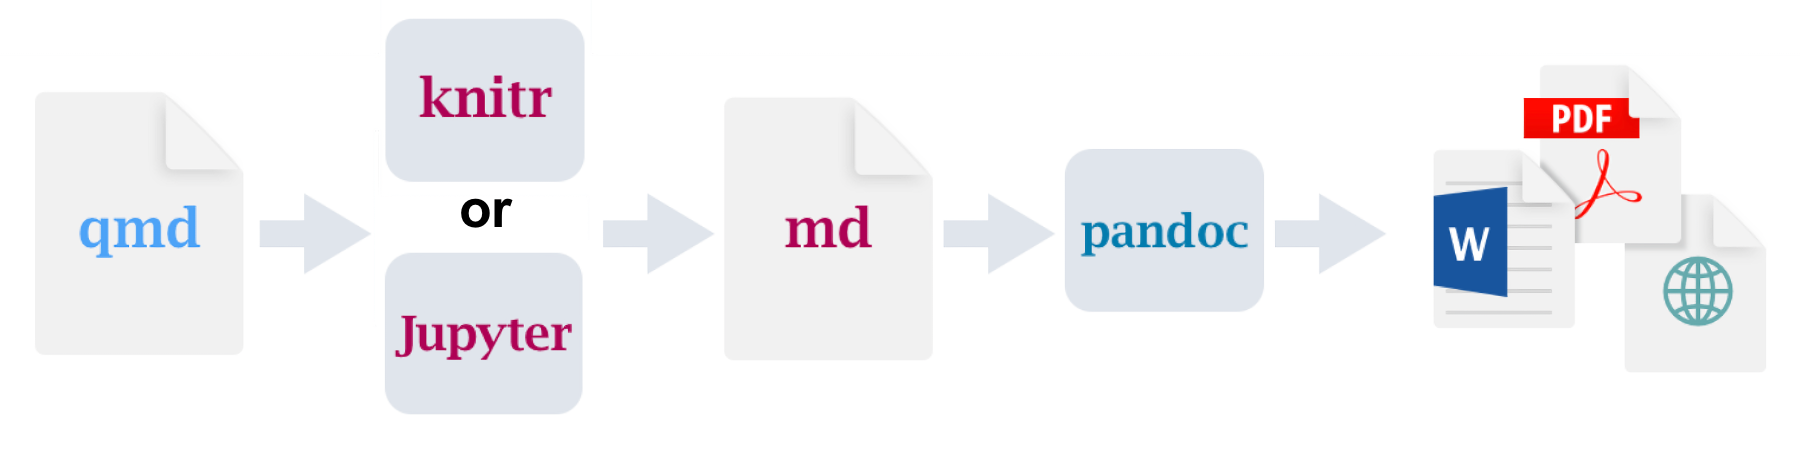
Figure 2: See walk-through by Alex Emmons for more detail.
Why invest in documentation (on top of the paper)?
What type of docs?
Project management/design documentation – such as the project charter, data management plan, etc. These help clearly state the success criteria for a project and keep you on track.
Documenation that explains the code. No matter how clear the structure or the scripts, the narrative explanation of steps to follow will still requires some documentation. Indeed, the list of specific steps may be clear from the analysis steps, but the why and the how will not be—hence both will also benefit from being made explicit.
Documenation to explain the process. A good way to provide clarity to any user without the context is to create a visual of the process flow. For instance, you can outline the process using mermaid diagrams, or use open source diagram tool (like draw.io or lucidchart) to draw the process yourself, export the image and embed that into the documentation (be sure you version to diagram file itself so that you can always tune the diagram and don’t have to recreate it!).3
All raw draw.io and exports for this site are saved in /docs/images/
Notable example
To showcase an exemplar for price statistics, we created a mock-up price index pipeline that researchers can explore.
Footnotes
See overview and explanations of version control in The Turing Way for more info.↩︎
There are multiple ways to do this, such as using Quarto scripts to pre-process input data, a light orchestration such as using DVC, developing and versioning a Makefile, etc.↩︎
Check out this overview guide on process mapping by the NHS.↩︎