CPI Production Systems
Interim Report with Survey Analysis
Upfront Admin
Work was done by Workstream 4 (CPI Systems and Architecture), which is part of the UN Task Team on Scanner Data under the UN Committee of Experts on Big Data and Data Science for Official Statistics.
We would like to acknowledge the team members of Workstream 4 who provided insights, helped draft survey questions, and supported this empirical assessment.
![]()
Note: Please consider reading the full interim report that accompanies this presentation.
Survey Concepts - Systems
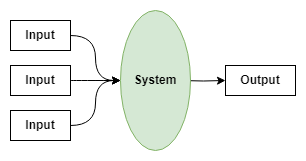
We define a system as any indivisible (atomic) software component that takes one or more data inputs and produces one or more data outputs.
Survey Concepts - Flow of Change
From left to right, we go from raw data to the production of the CPI.

Flow of change based loosely on the General Statistical Business Process Model (GSBPM).
Survey Concepts - Monolithic vs. Modular Architectures


Results - Commercial Software Use
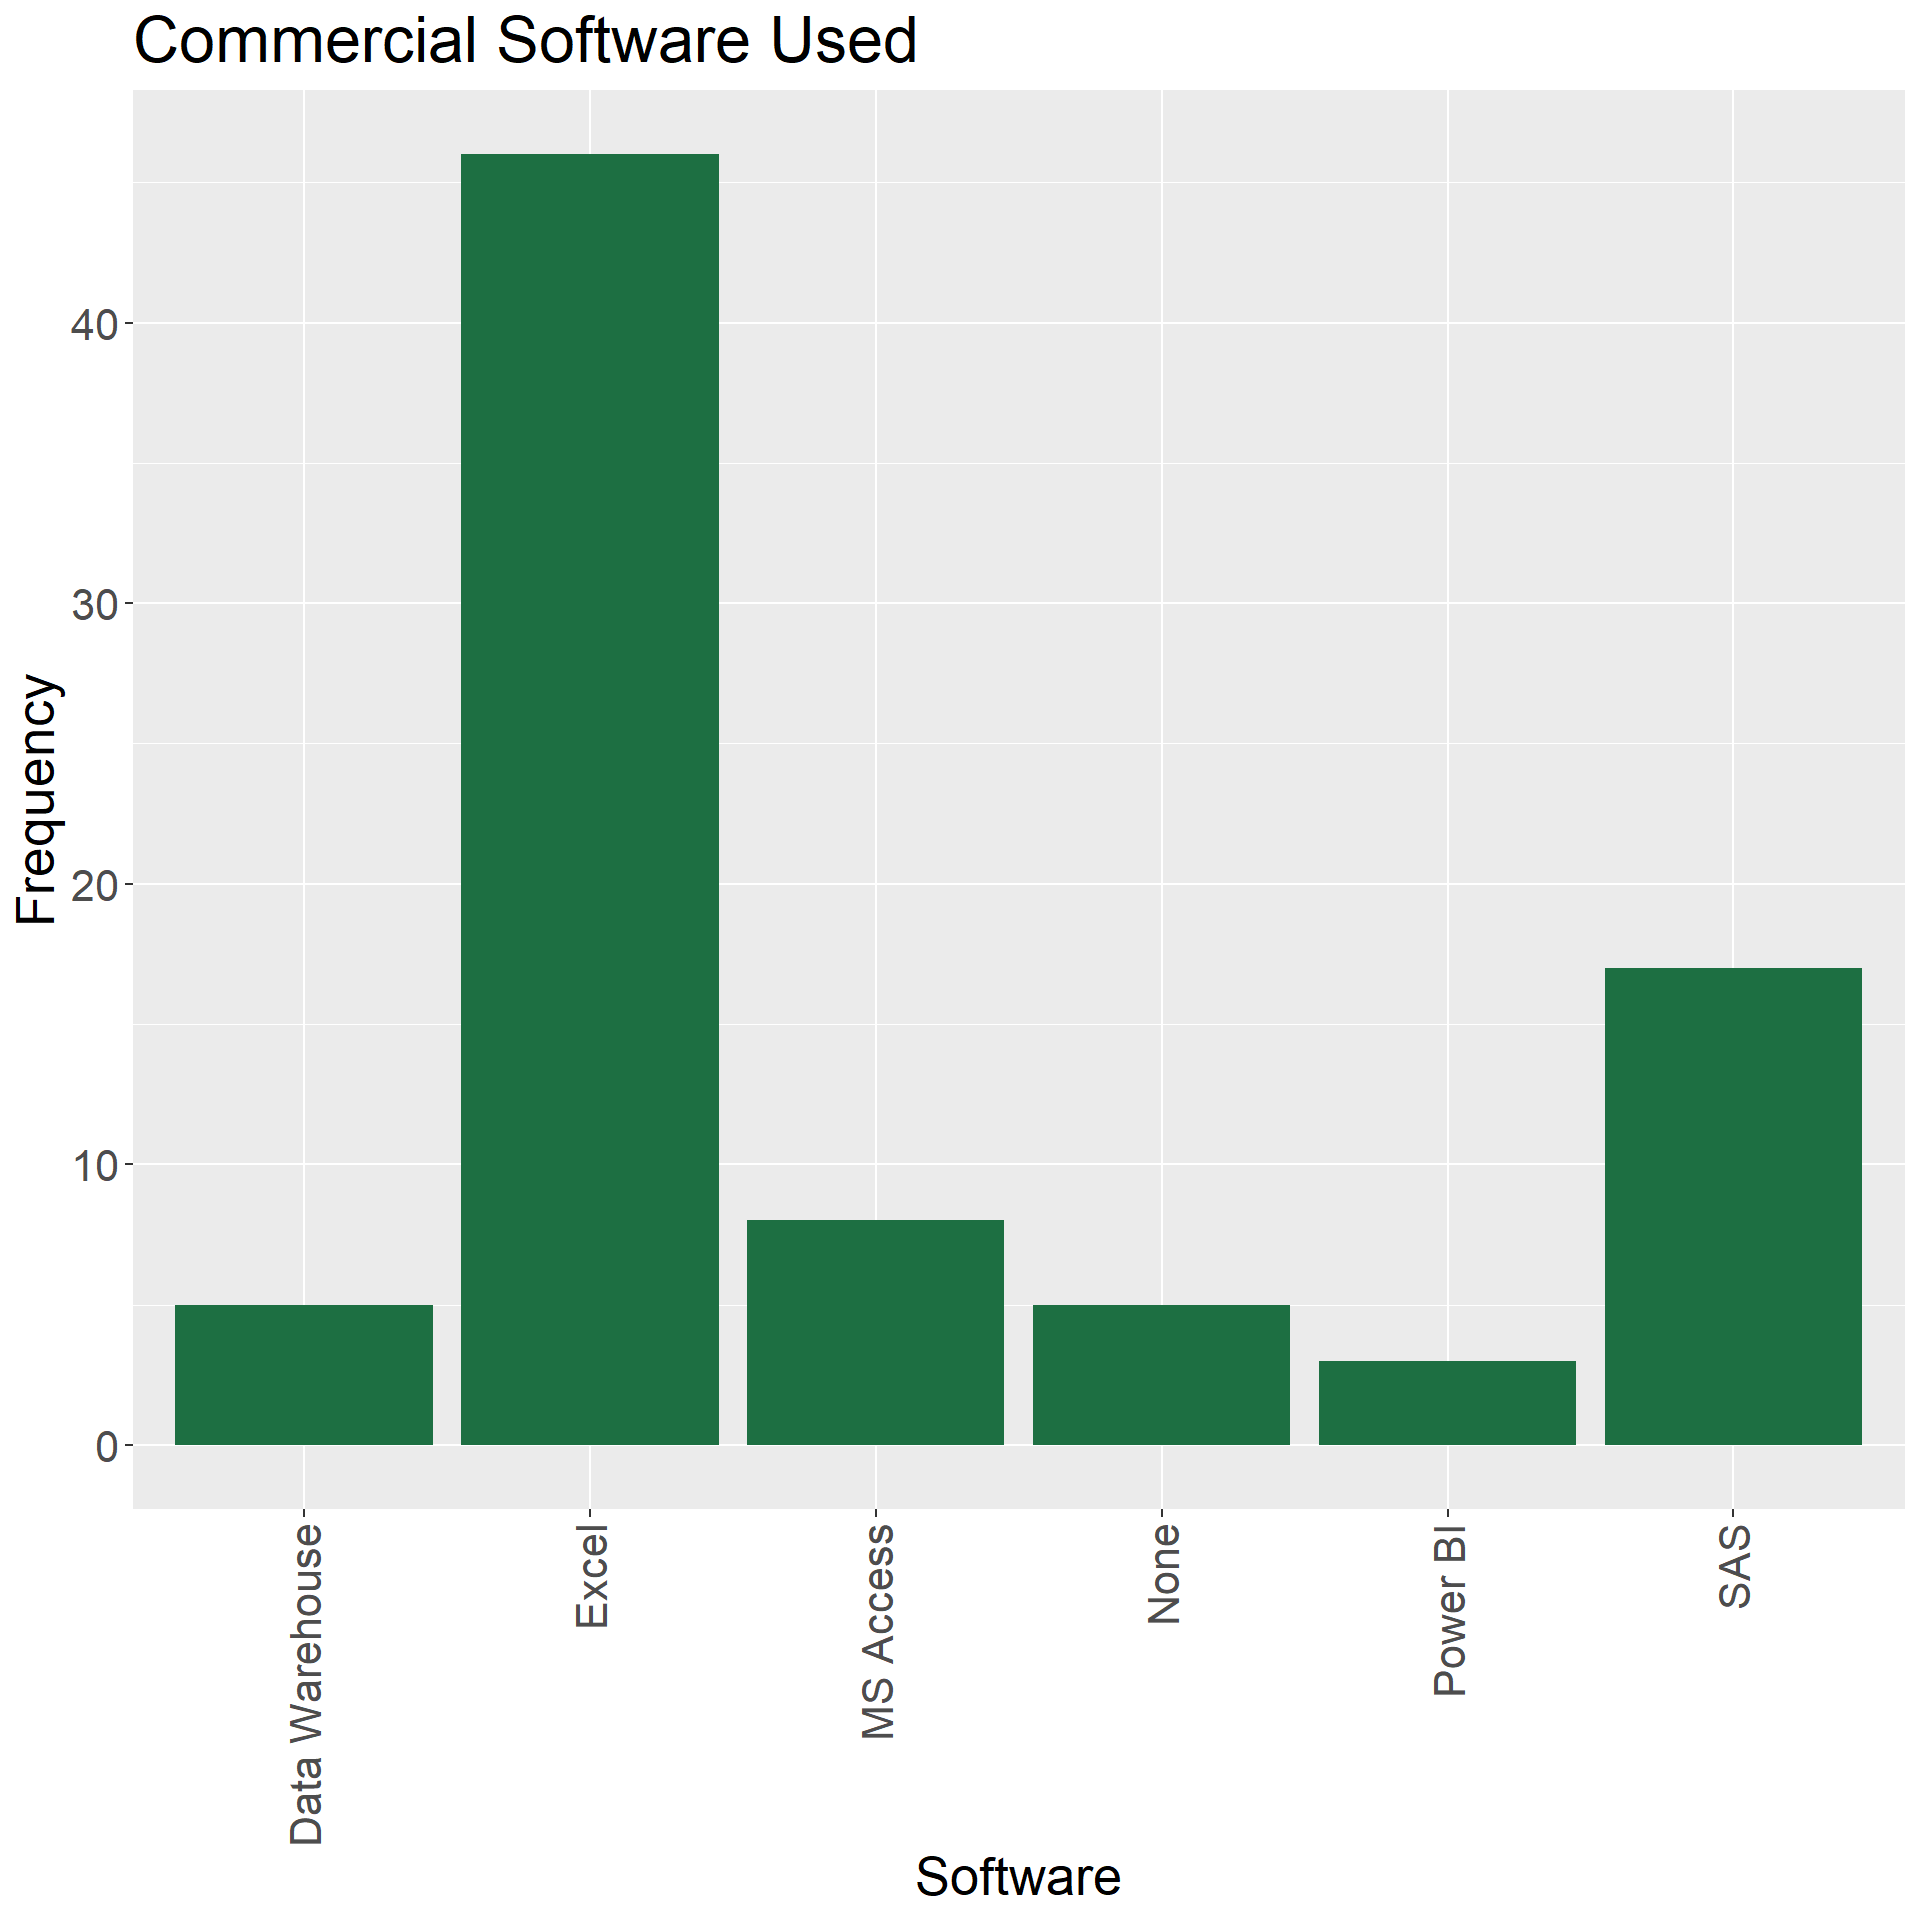
Over 2/3 of the respondents listed that Microsoft Excel was used in their CPI Production Systems.
Spreadsheets are useful for tabular data analysis, however, they are not ideal tool for expressing complex business logic.
Excel Workbooks encourage a high degree of coupling between business logic and data.
Results - Project Management Software Use
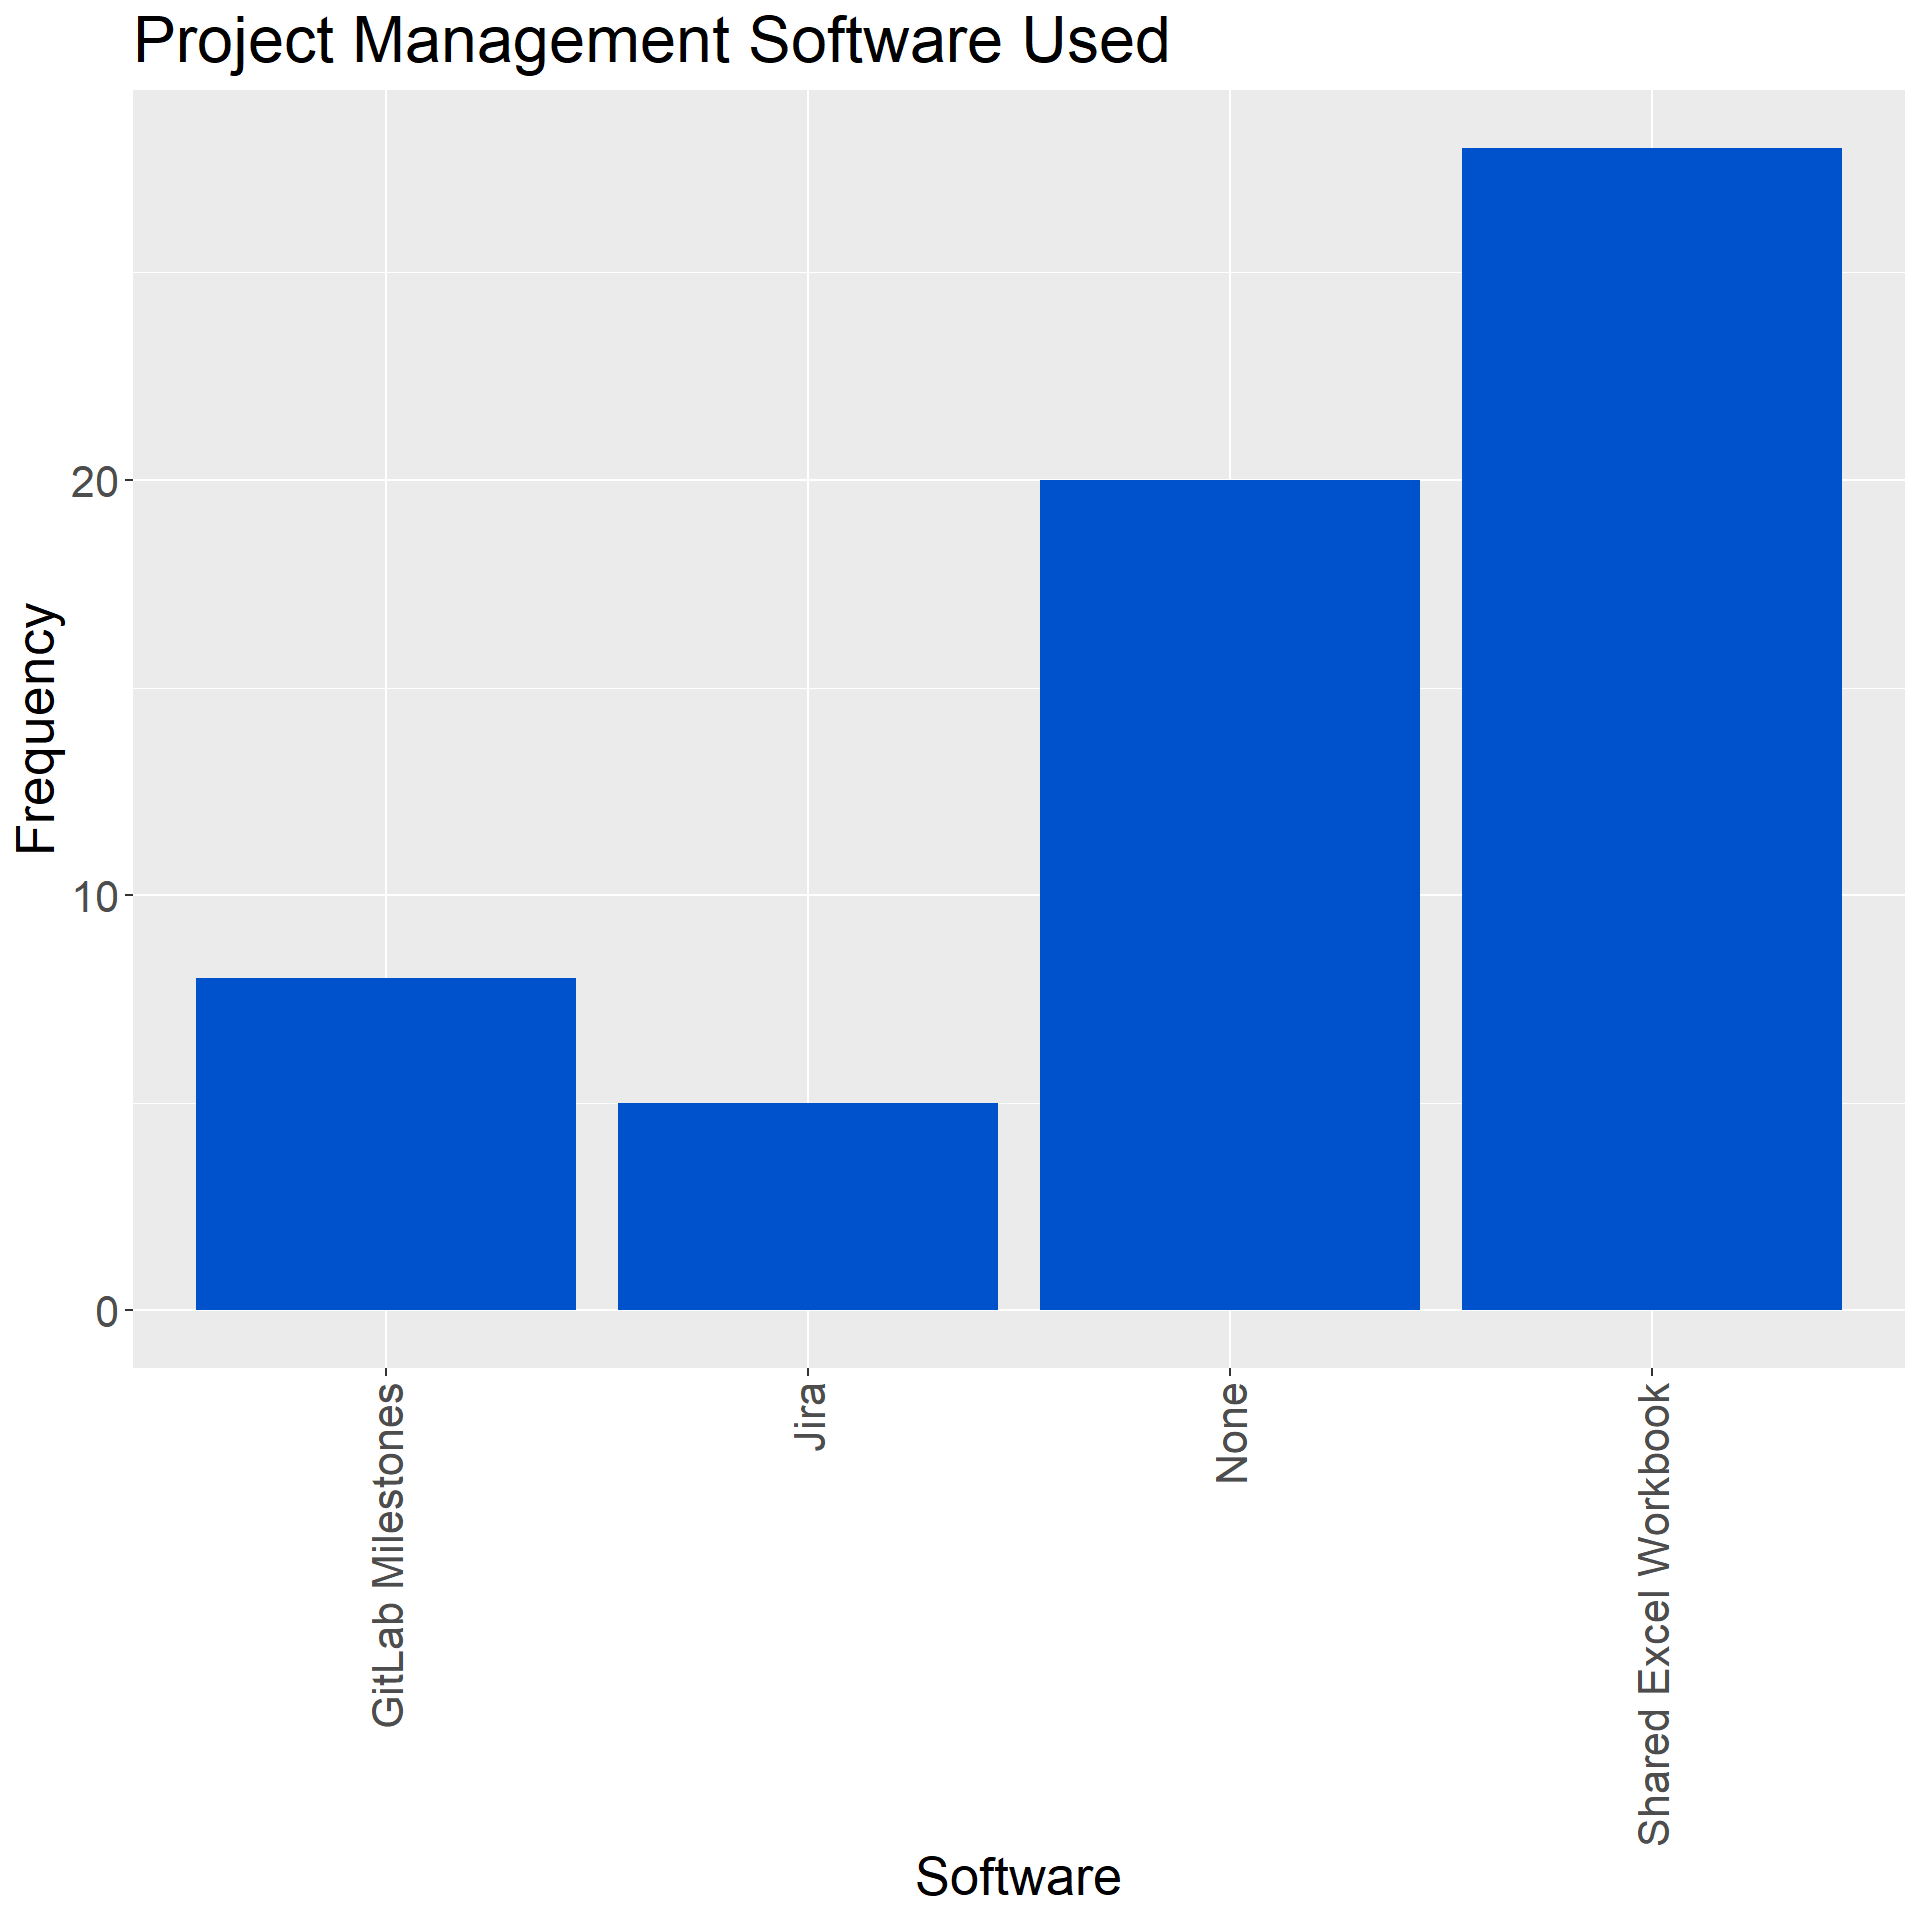
28 respondents report using a shared Excel workbook for project management.
20 report using no software for project management.
14 report using some other software for project management, such as Jira, GitLab, or GitHub.
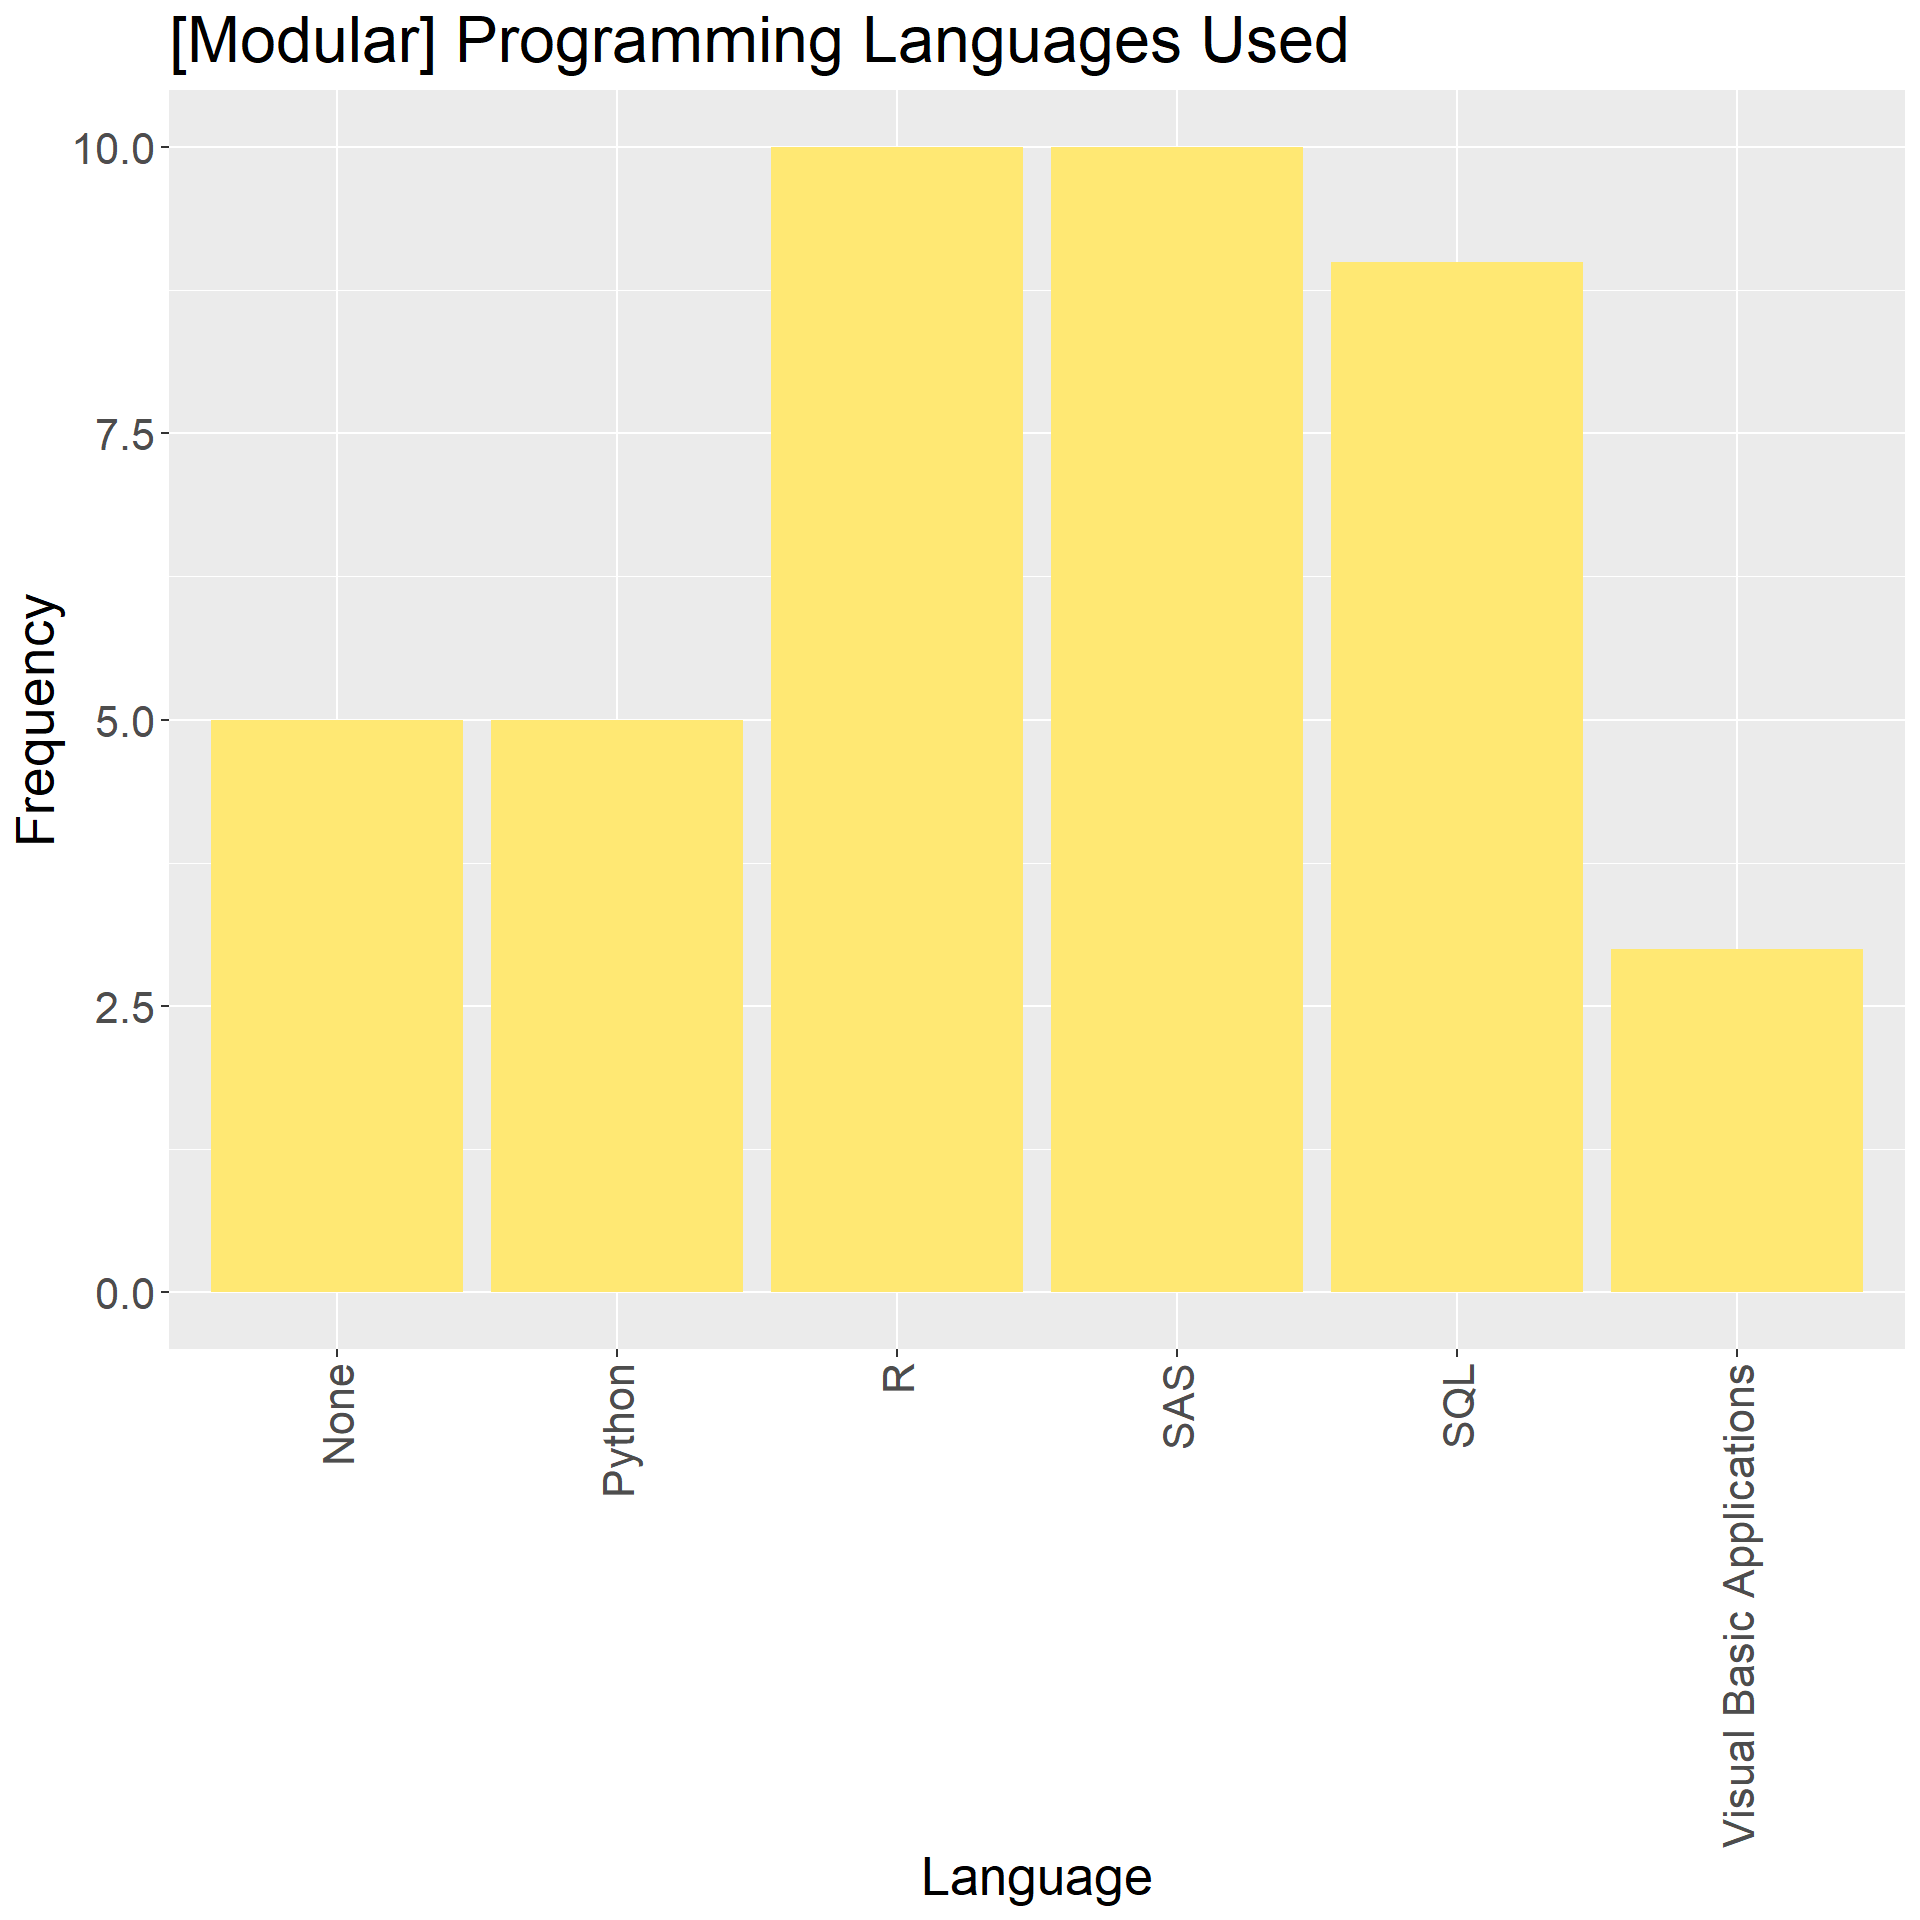
Results - Programming Language Use
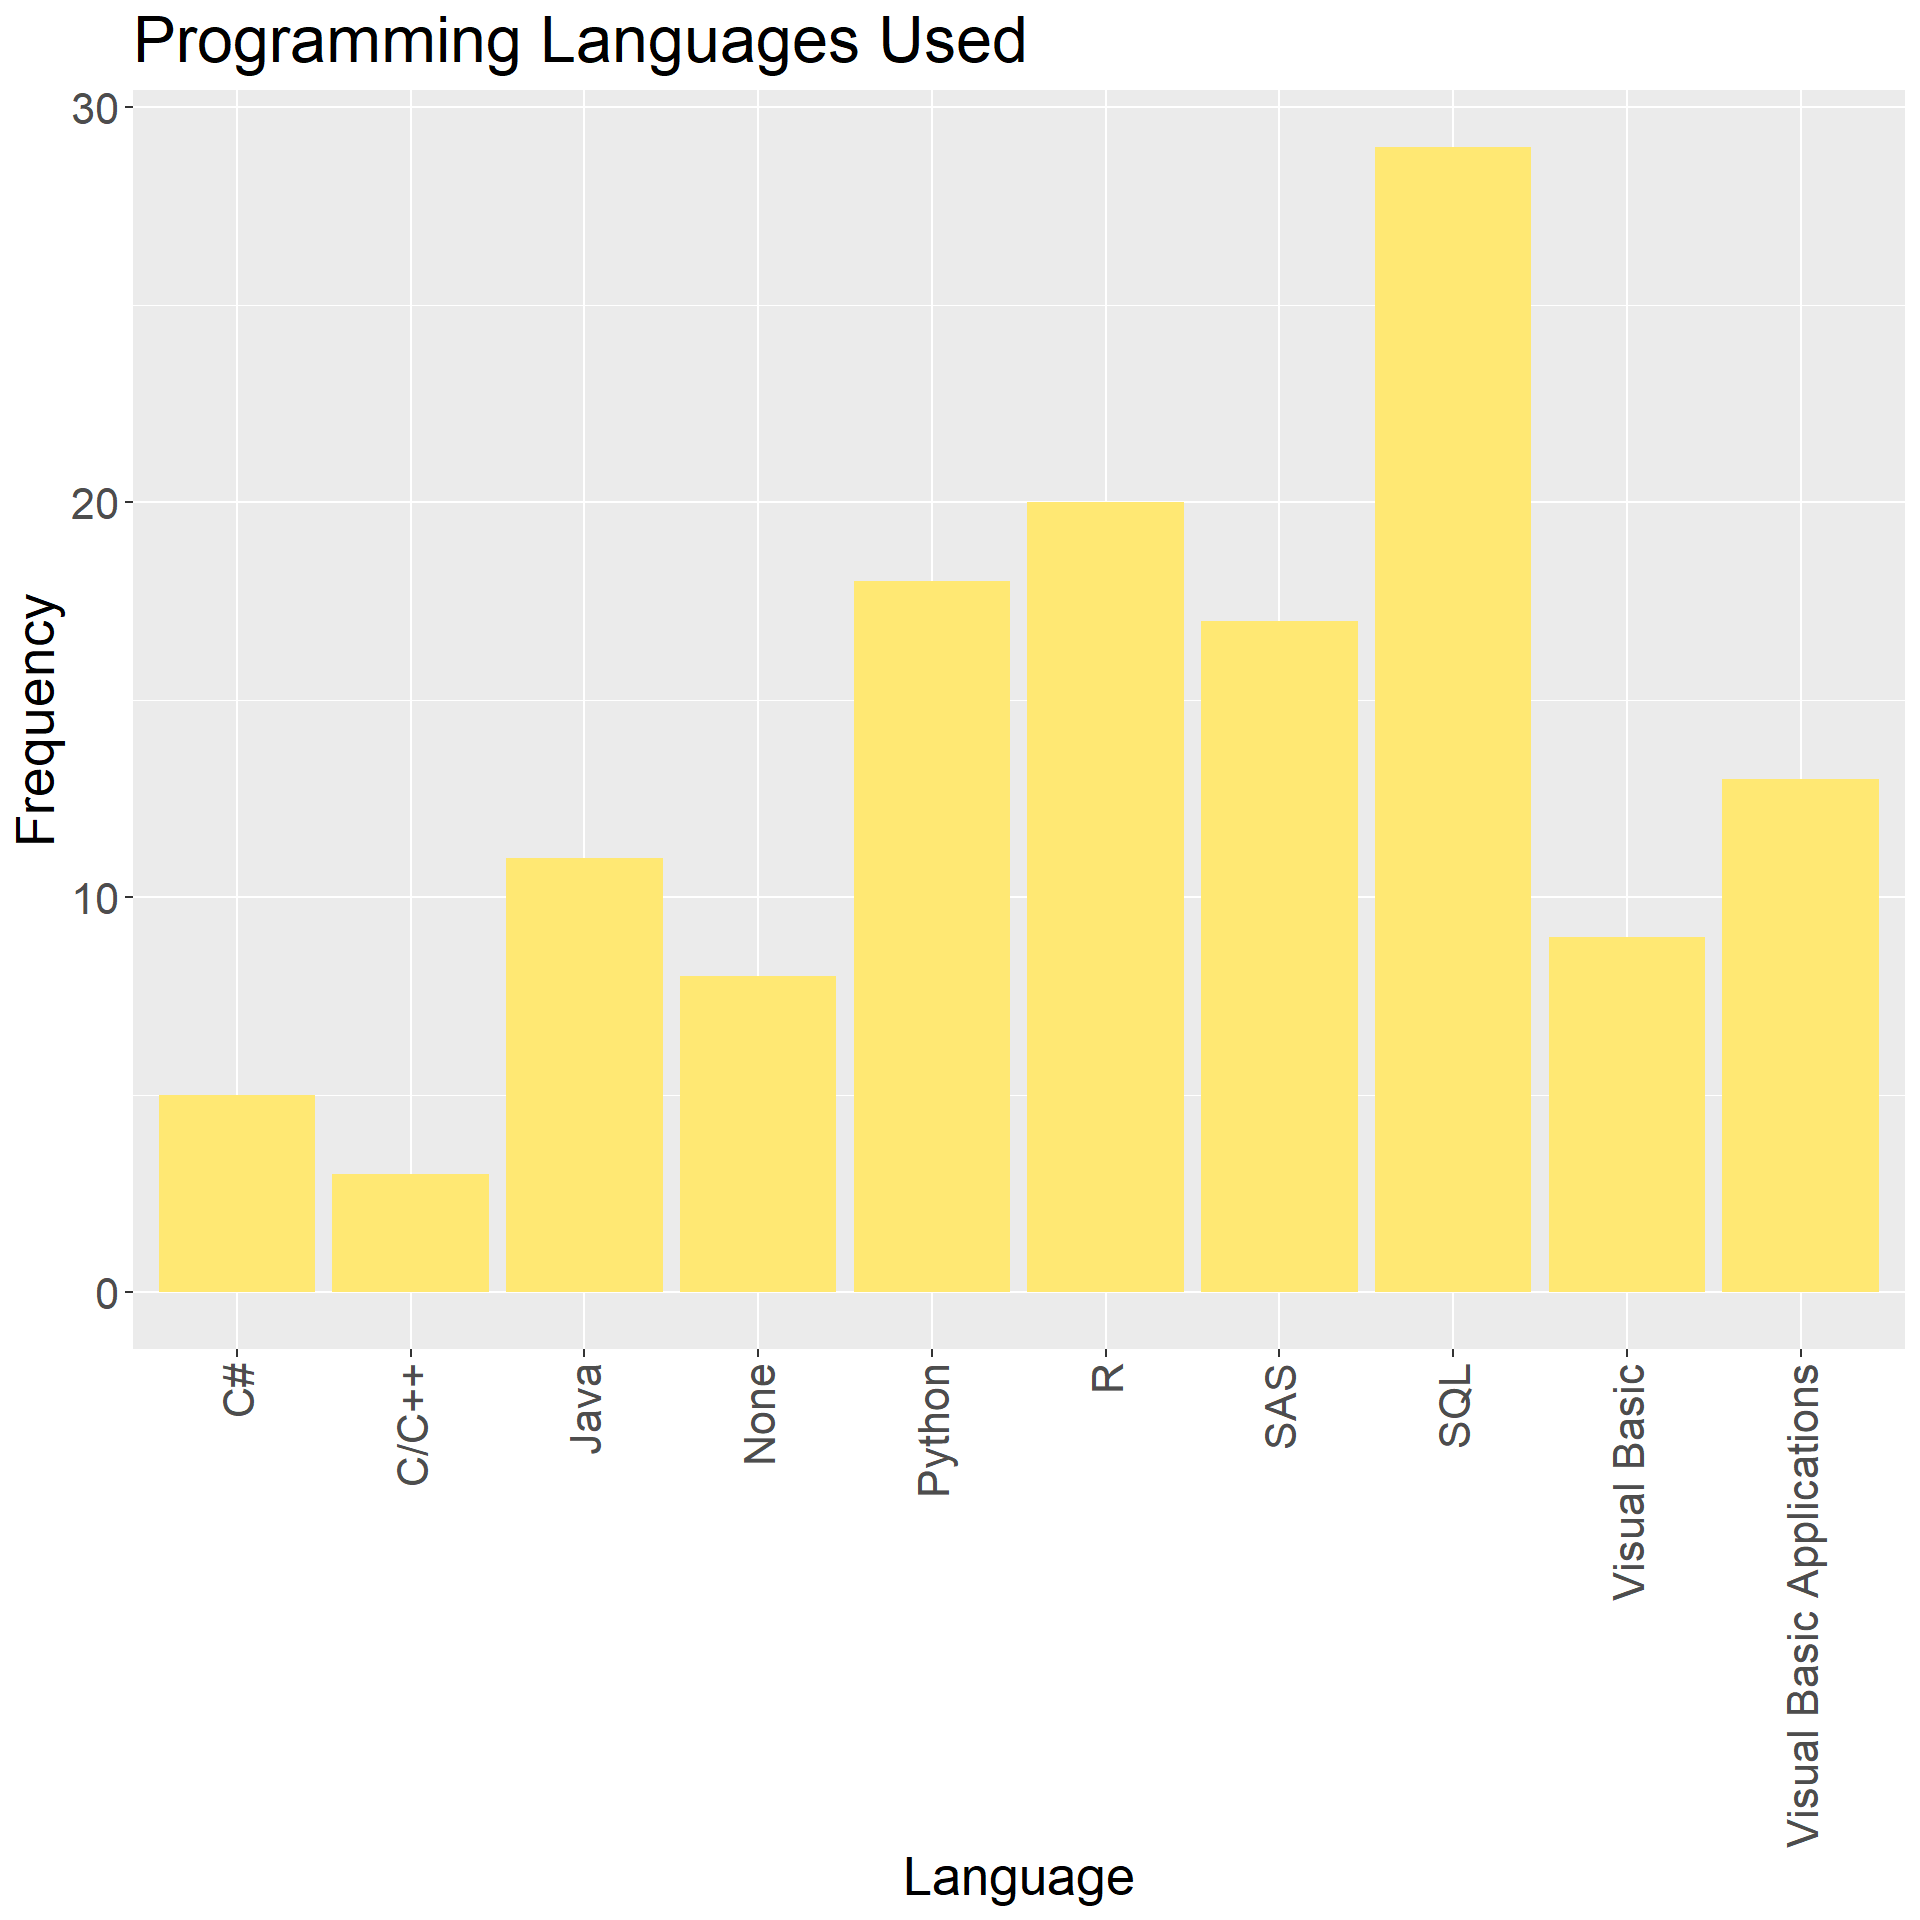
29 respondents reported using SQL in their CPI Production Systems.
31 reported using Python or R or SAS.
14 reported using Python or R, but not SAS.
8 reported using no programming language.
Results - Storage Use
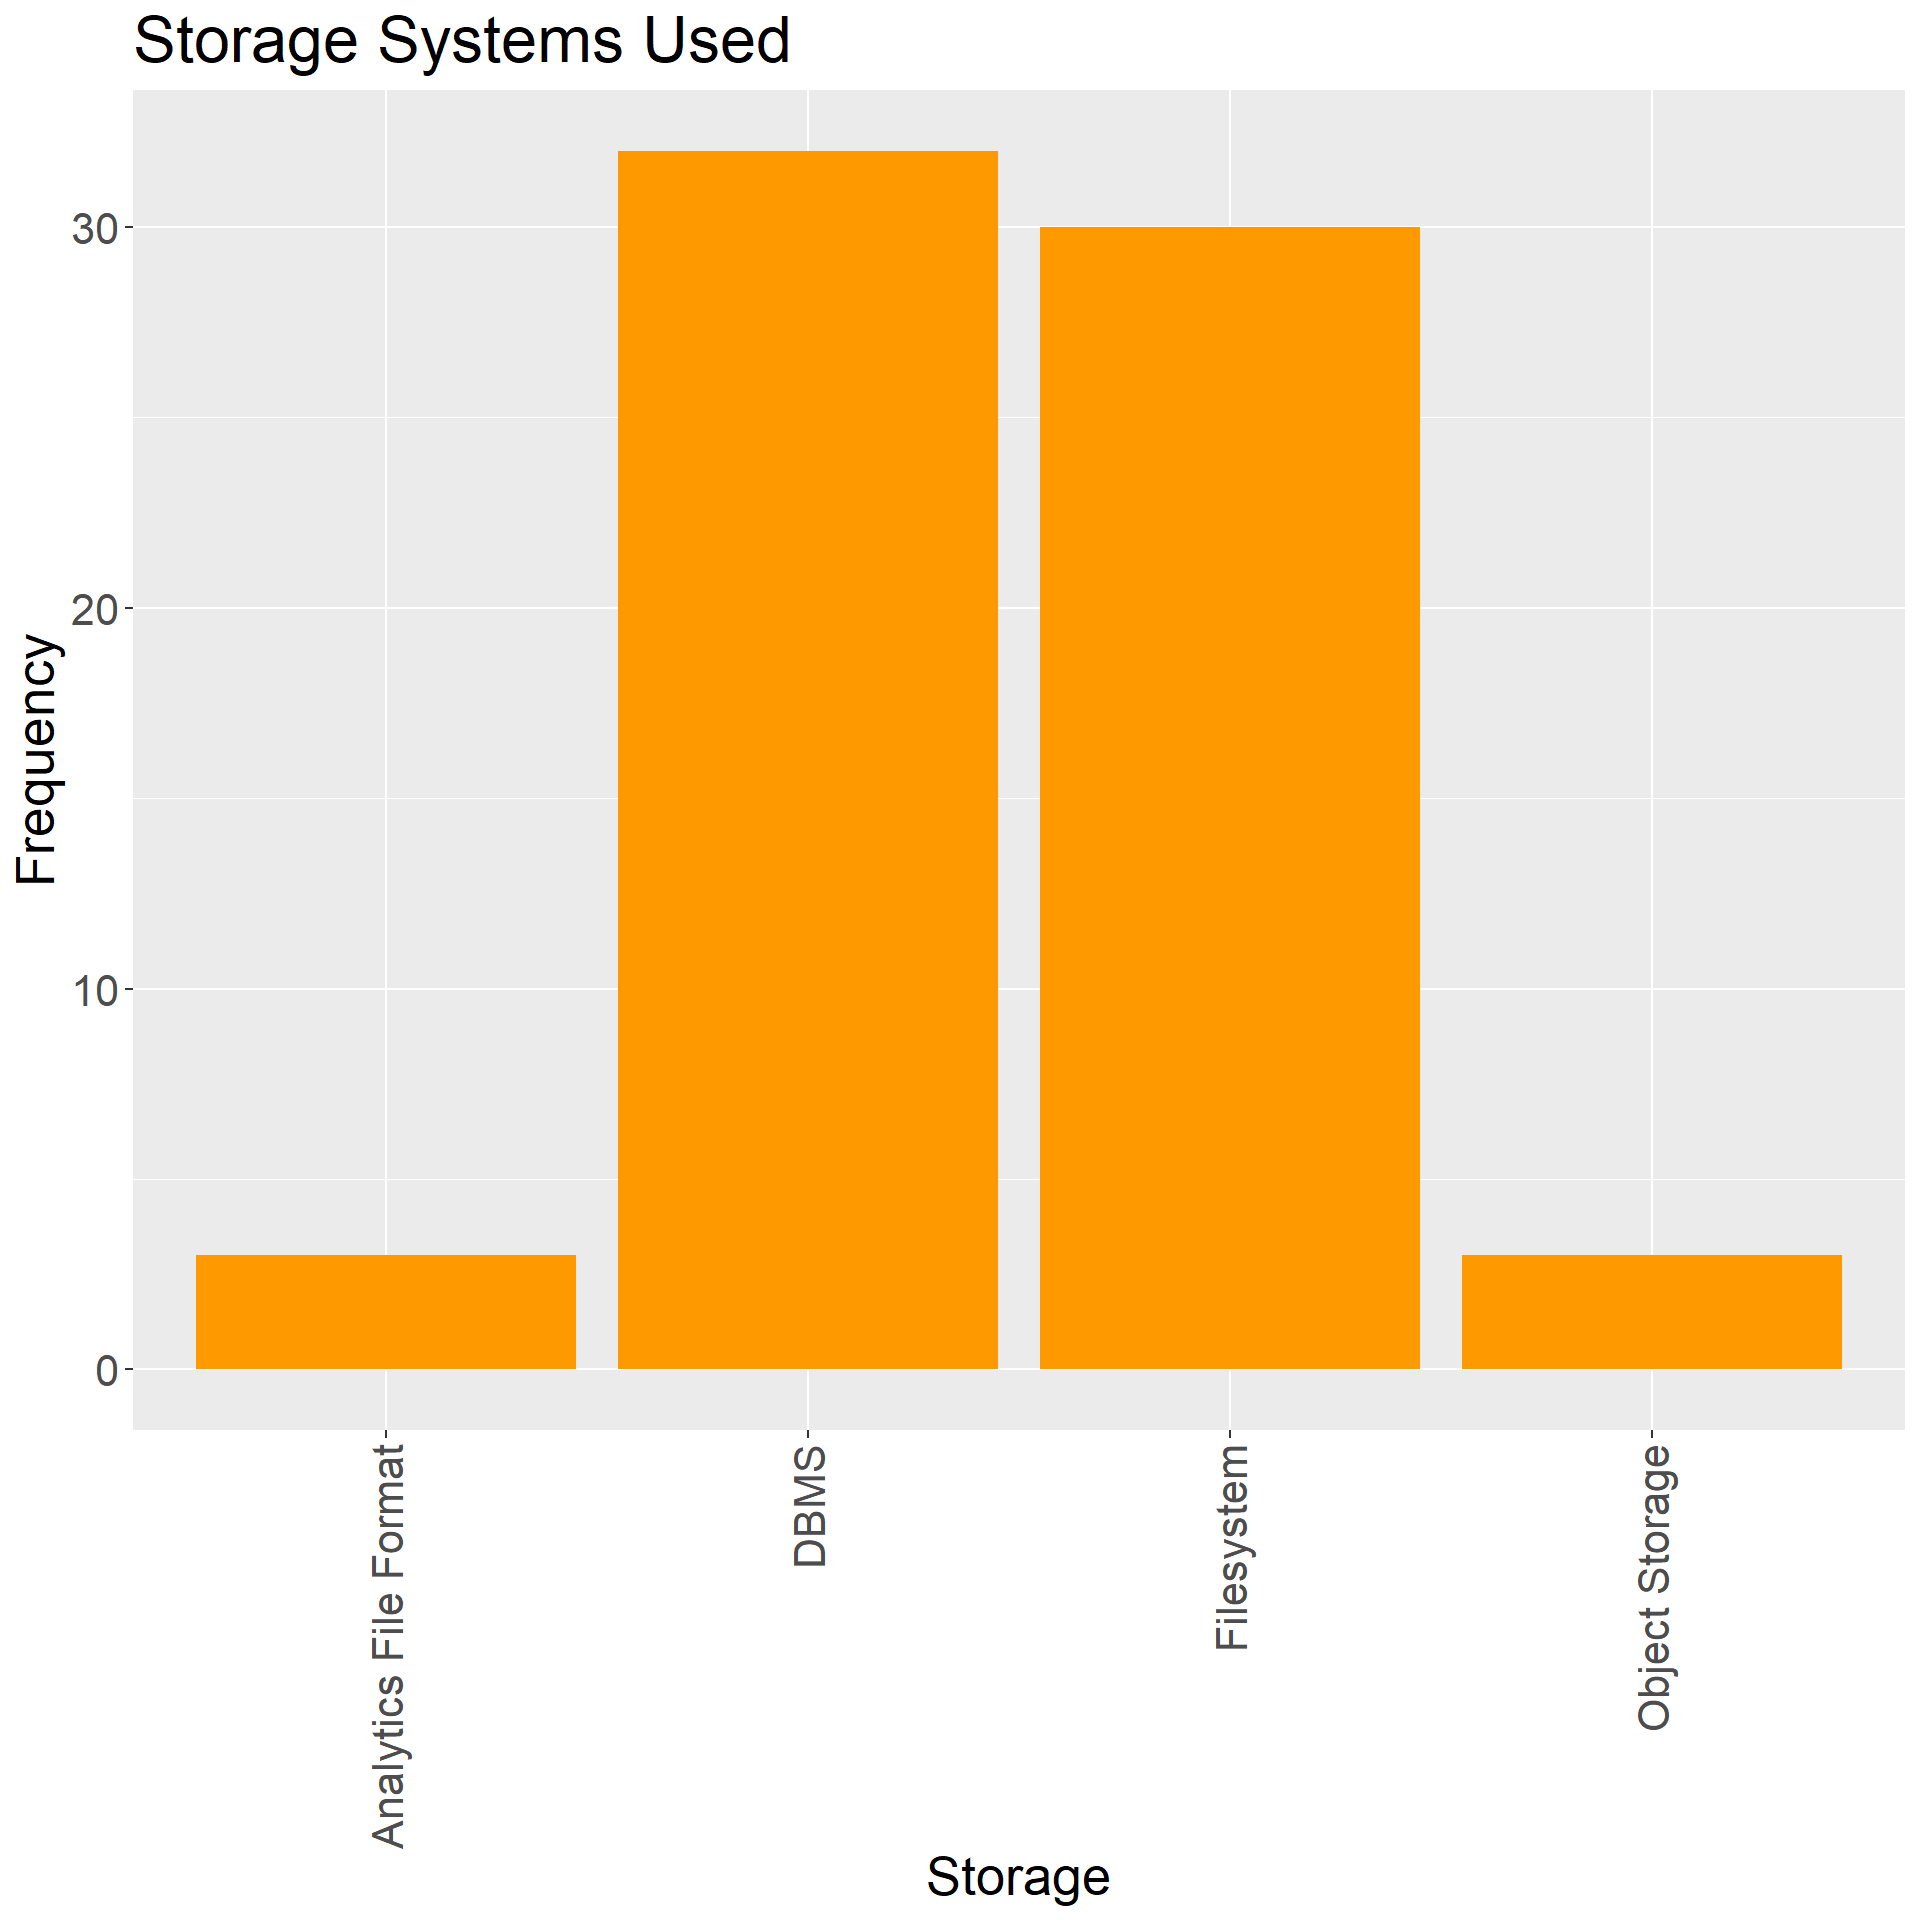
Only 3 respondents use analytics optimized file formats such as Apache Parquet.
Approximately equal split between use of filesystem and database management system (DBMS) for data storage.
Only 3 respondents use an object storage solution such as Azure Data Lake Storage or AWS S3.
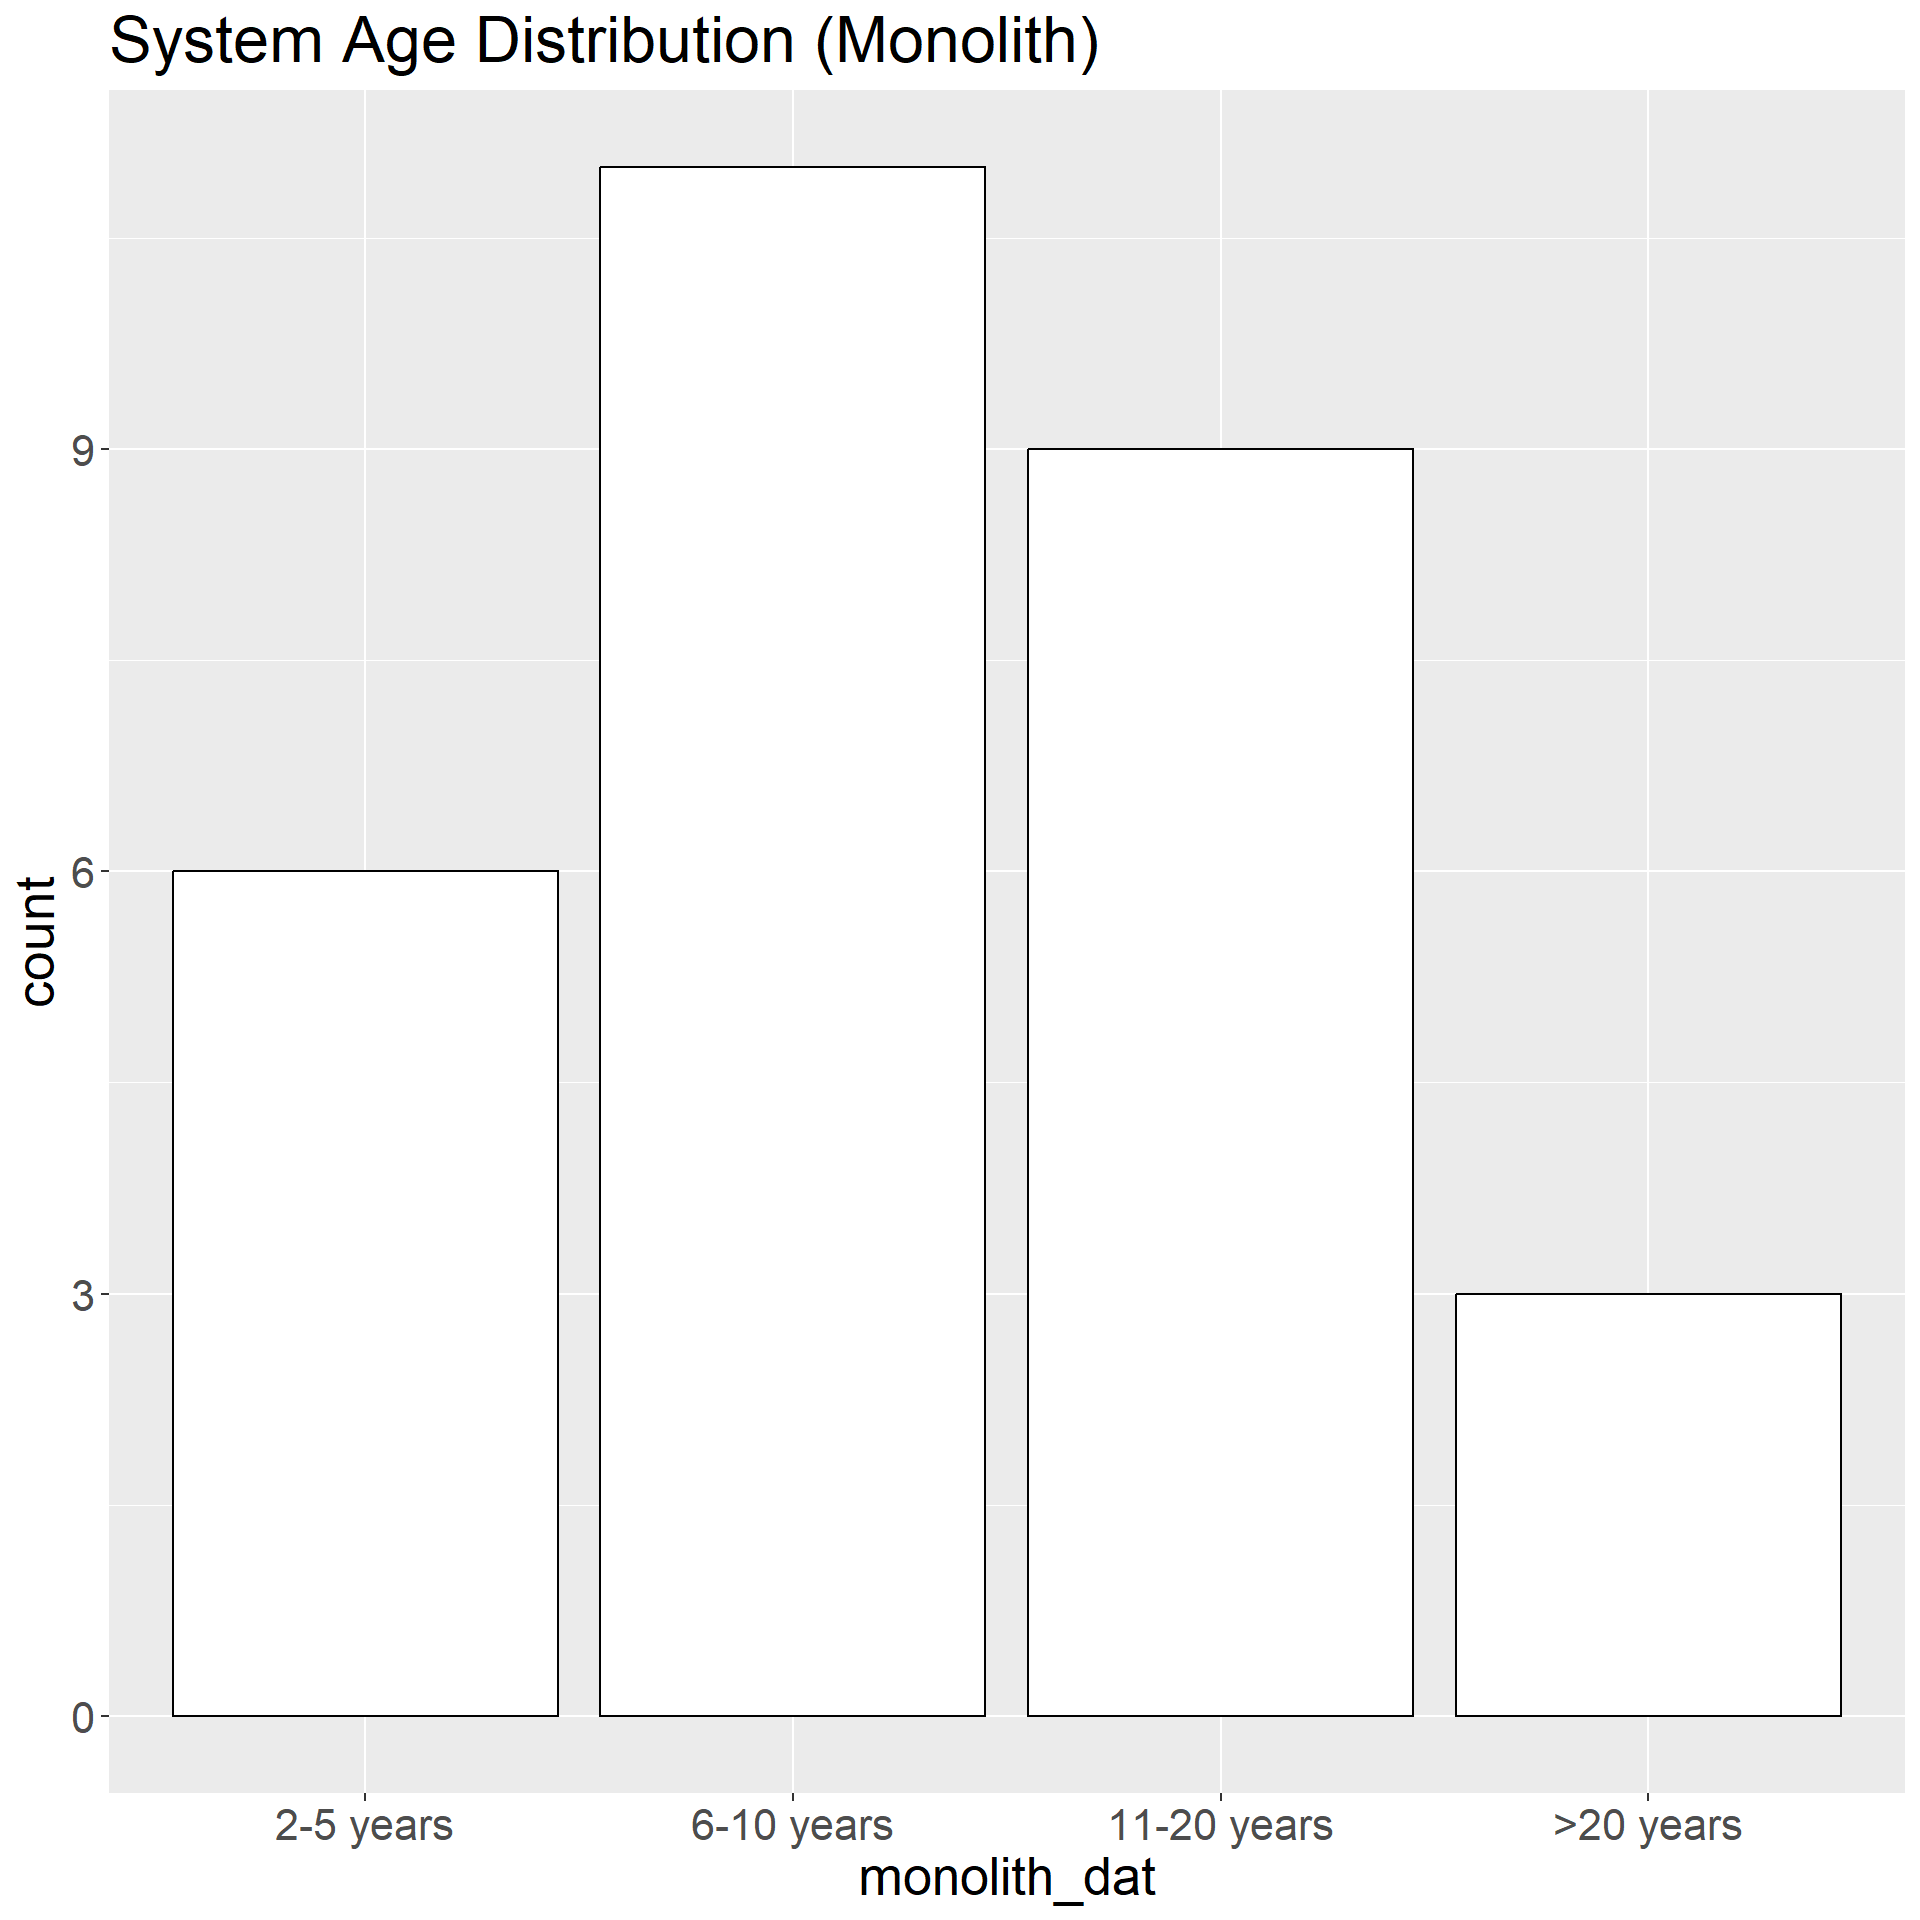
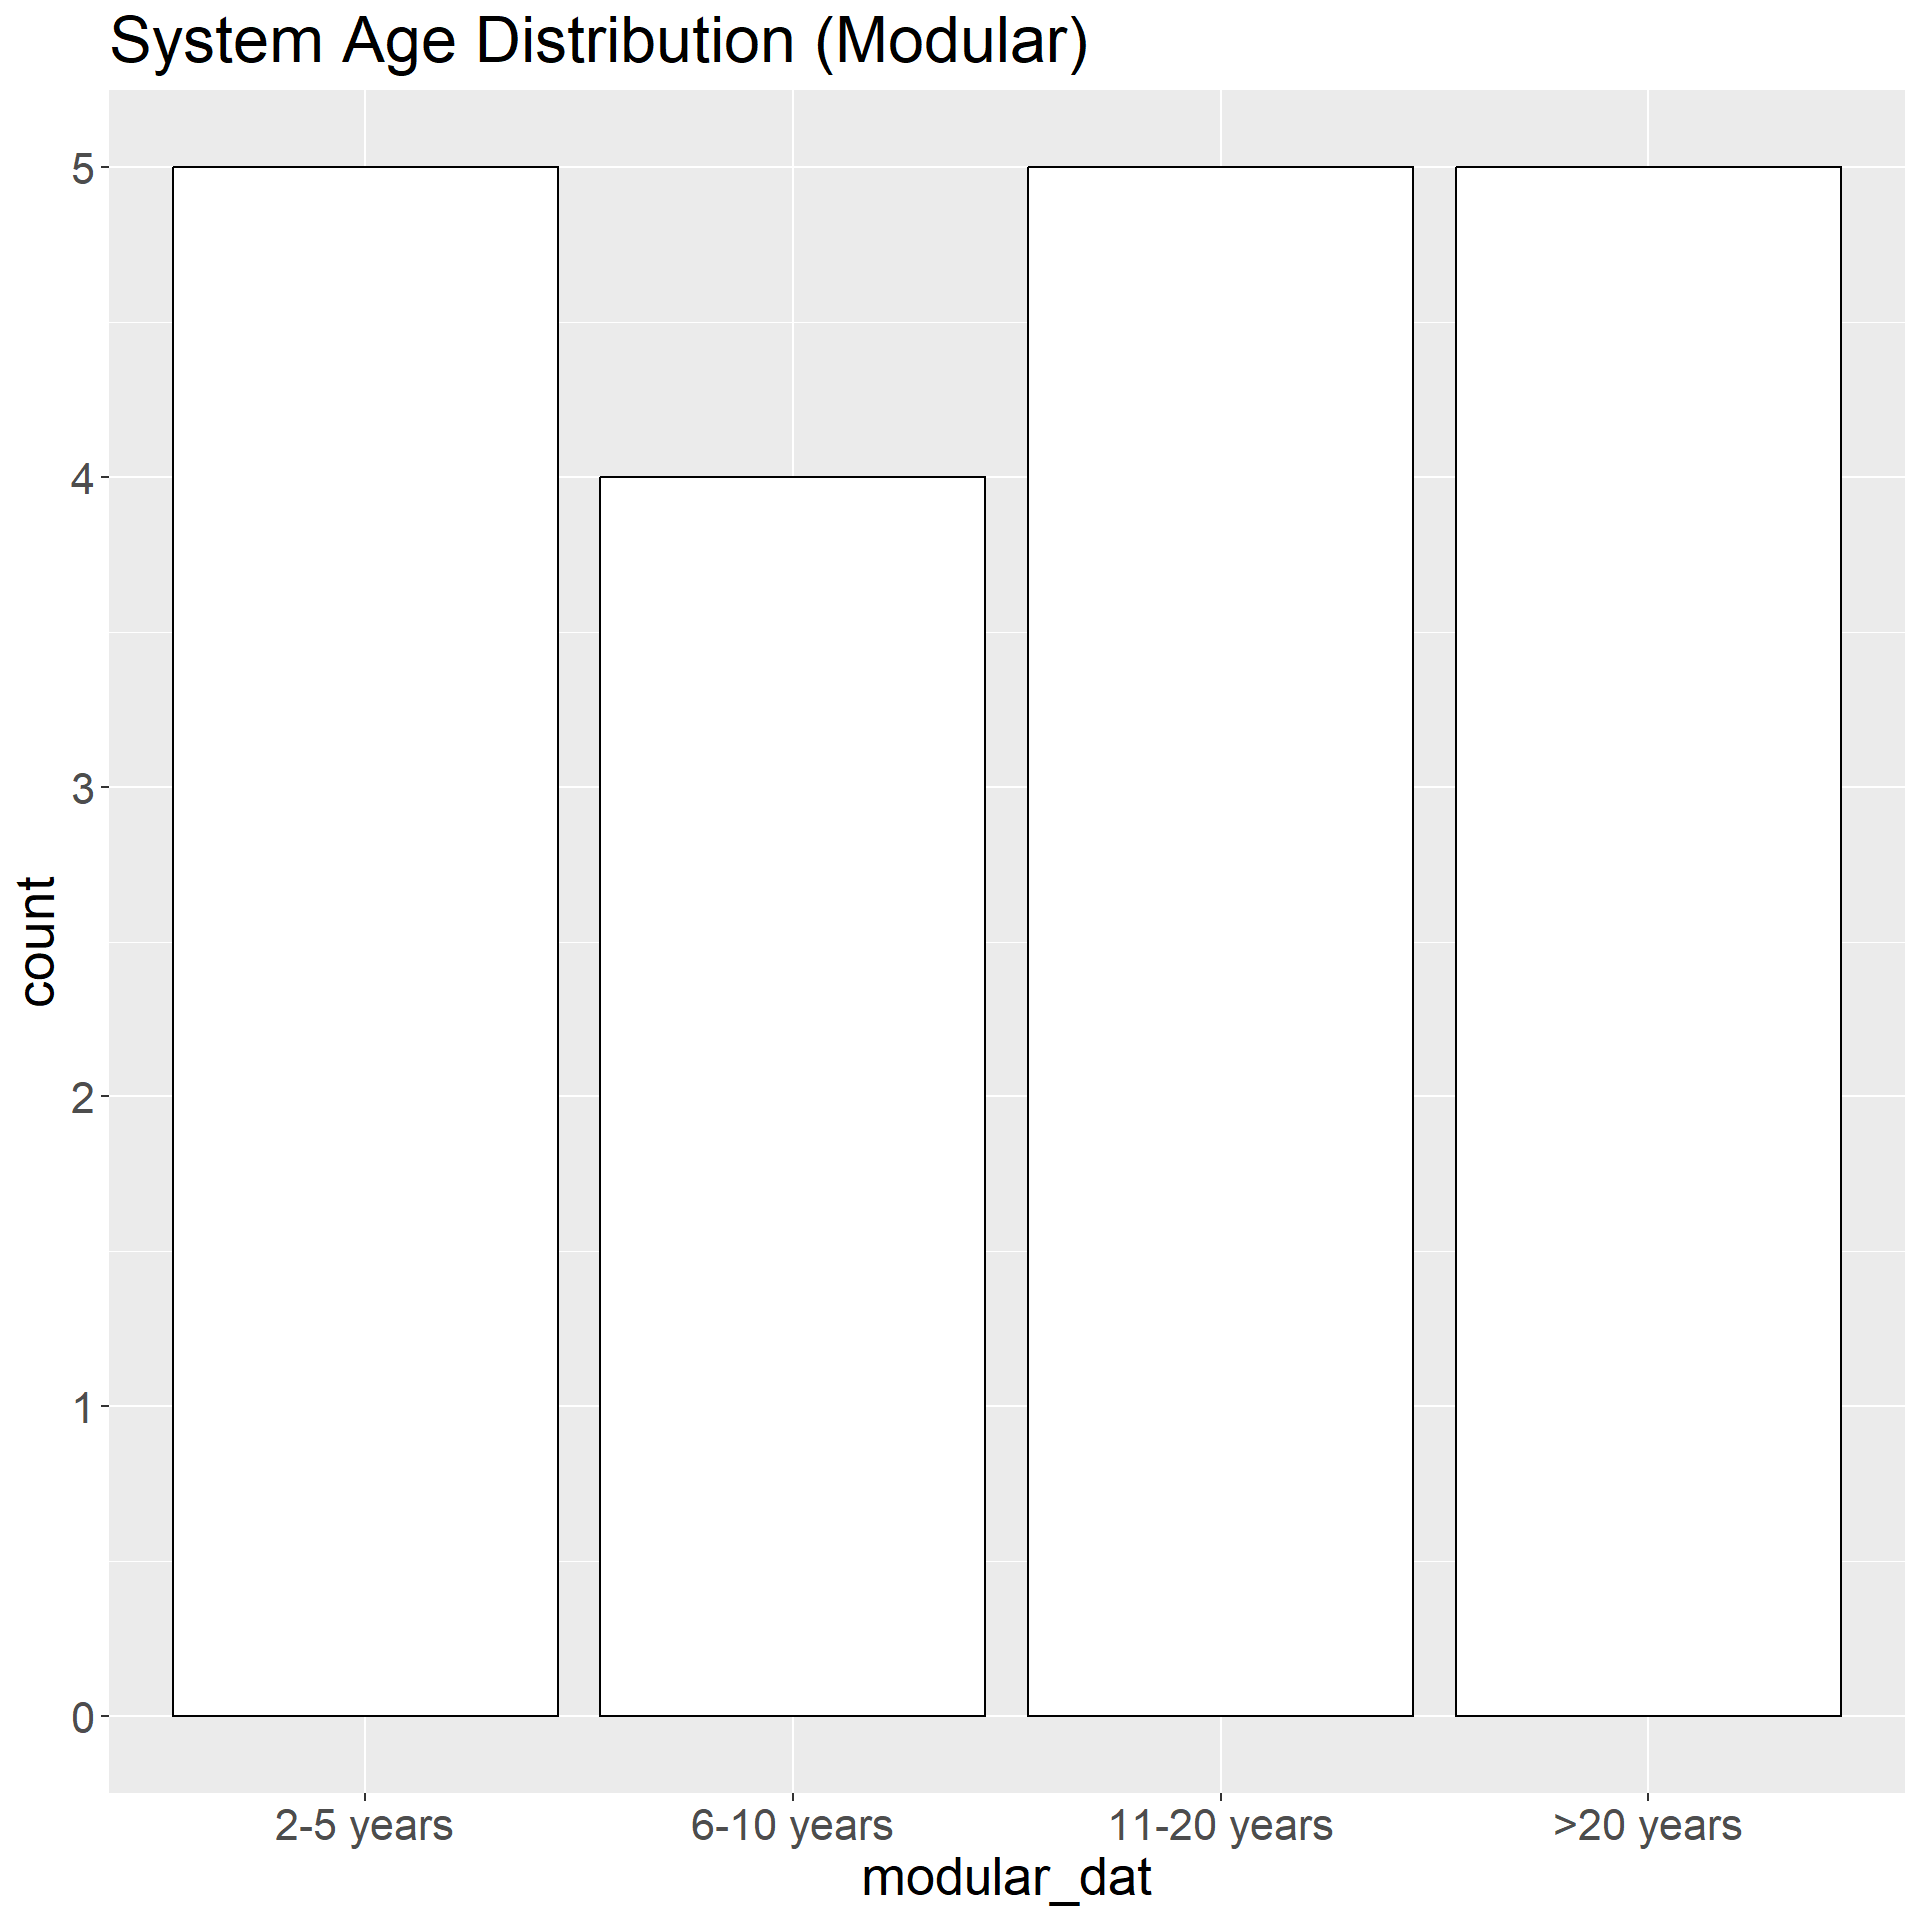
Results - System Age
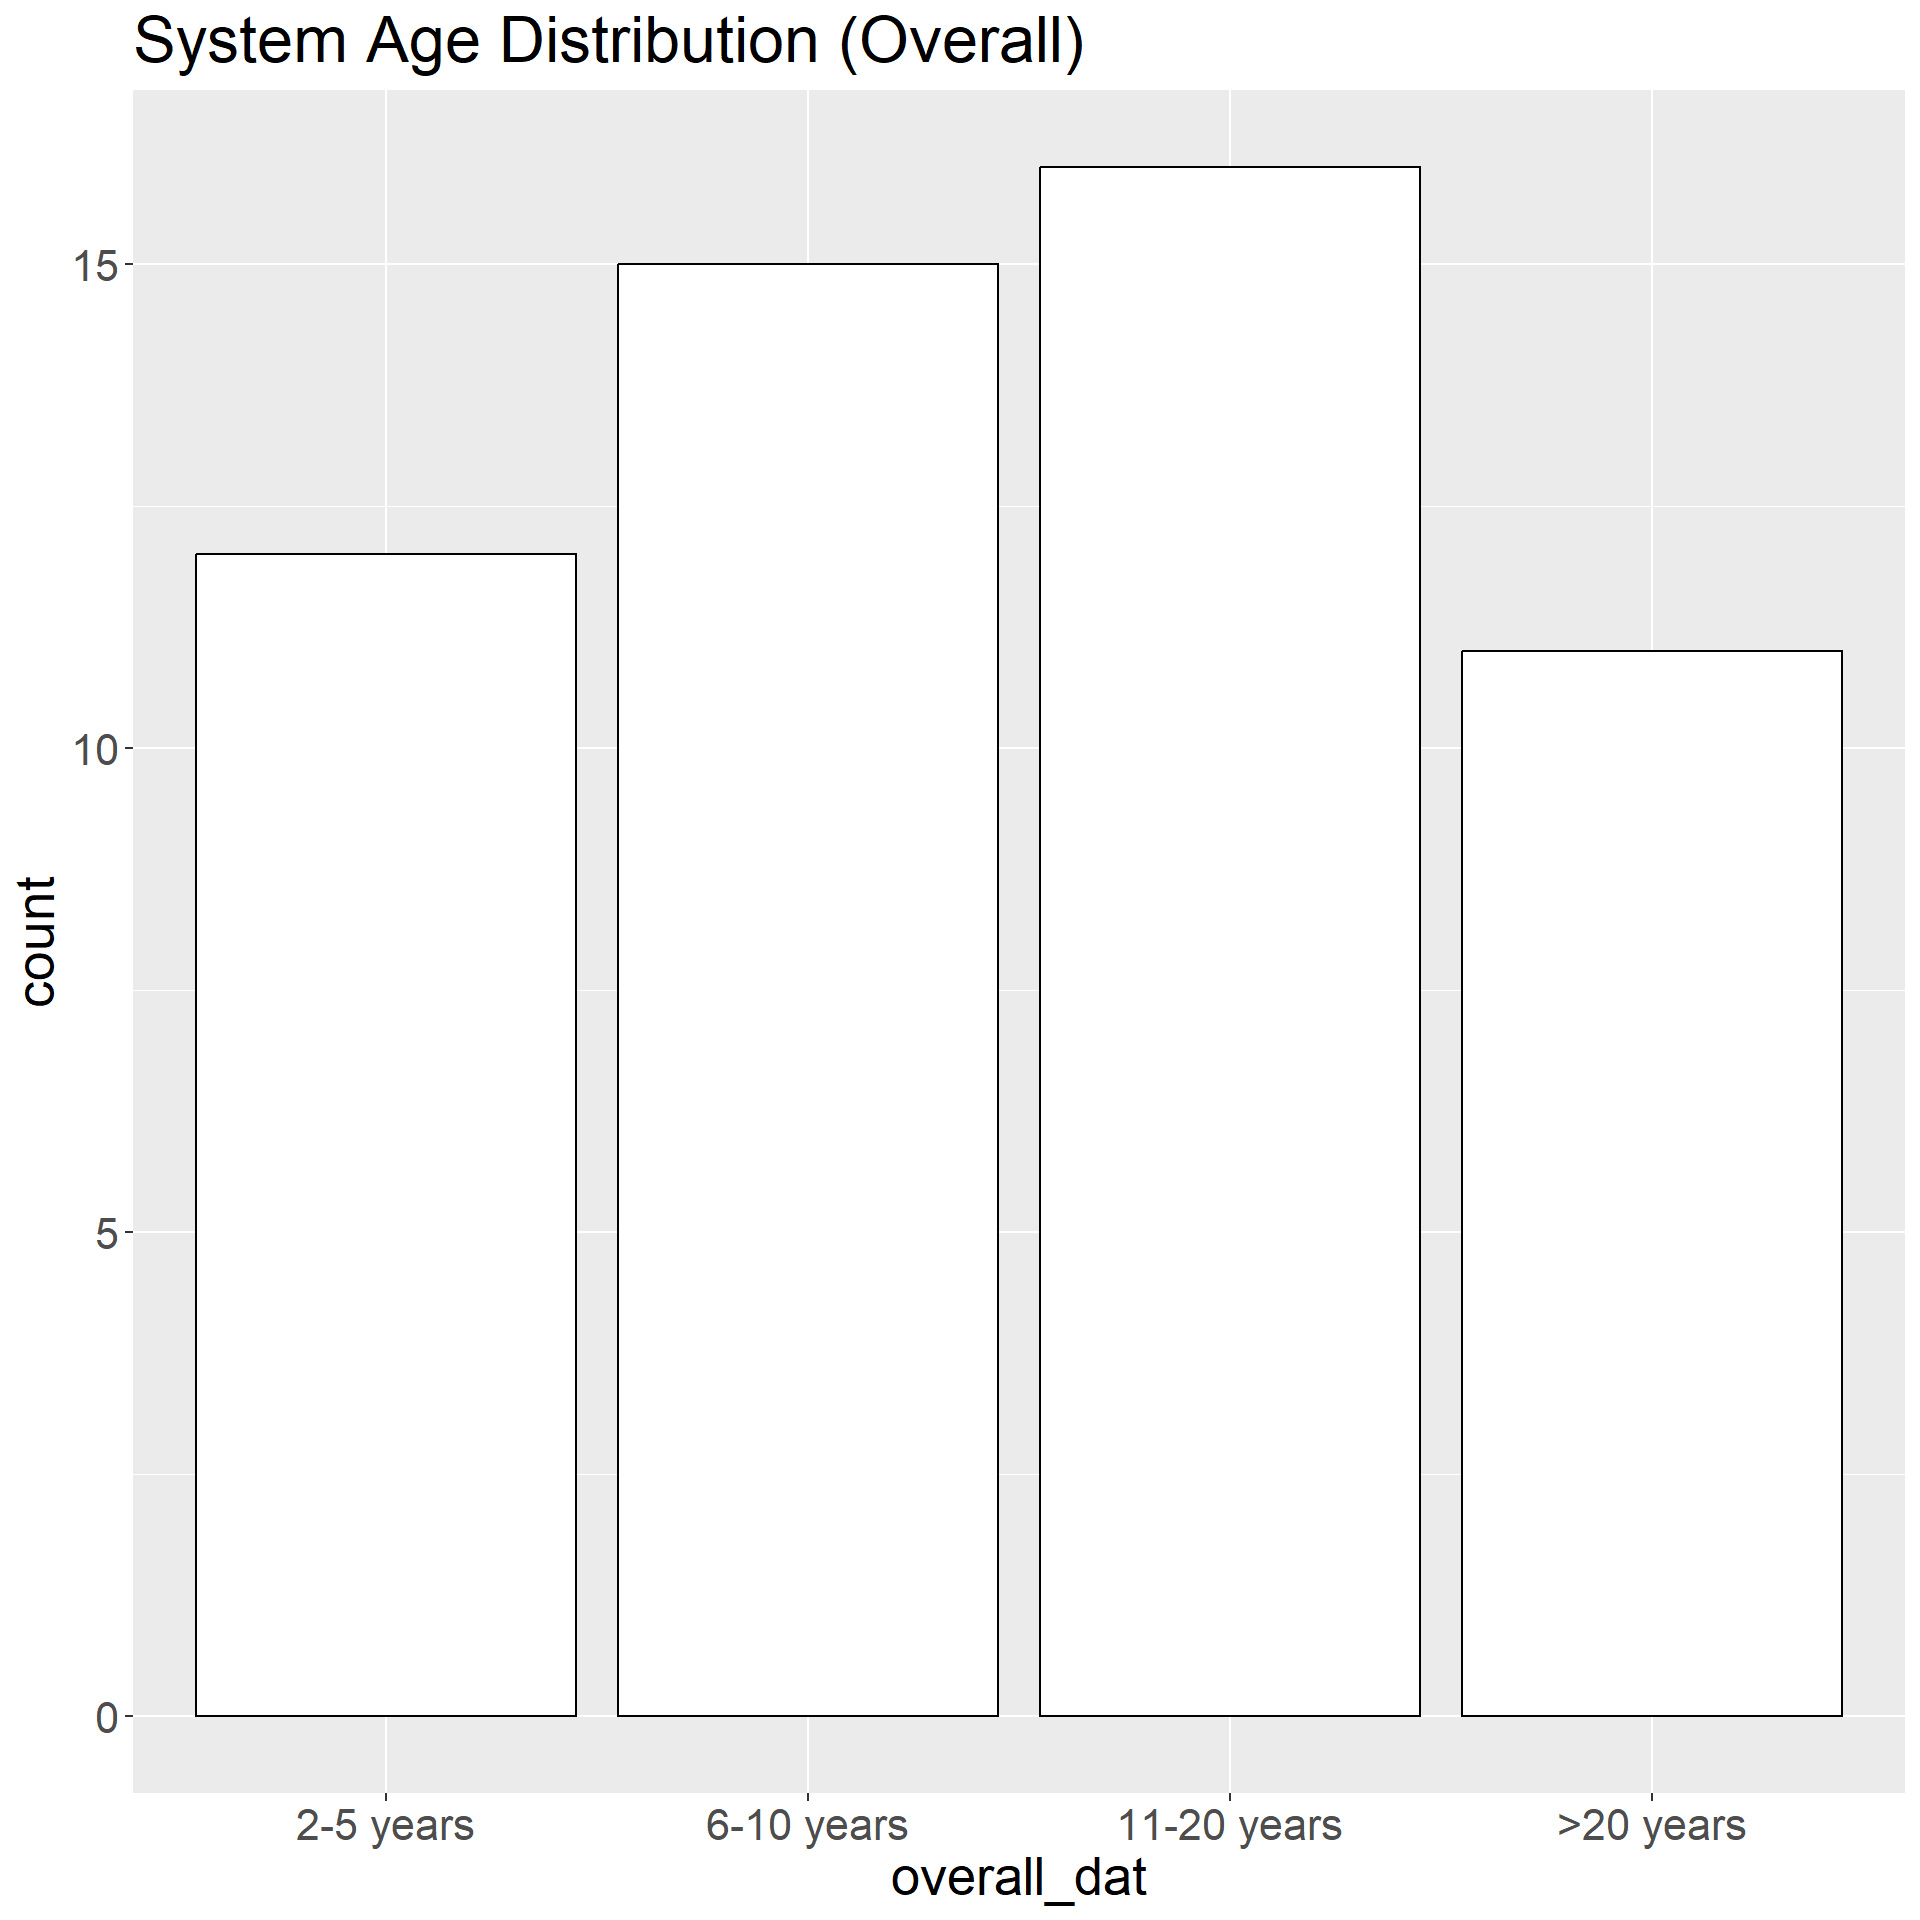
Monolithic architectures most likely to have systems aged
Between 6-10 yearsorBetween 11-20 yearsold.IT-Only teams are less likely to have systems
> 20 yearsold compared to Stream Aligned teams.By far most common answer for Other Mix teams is system age
Between 6-10 yearsold.
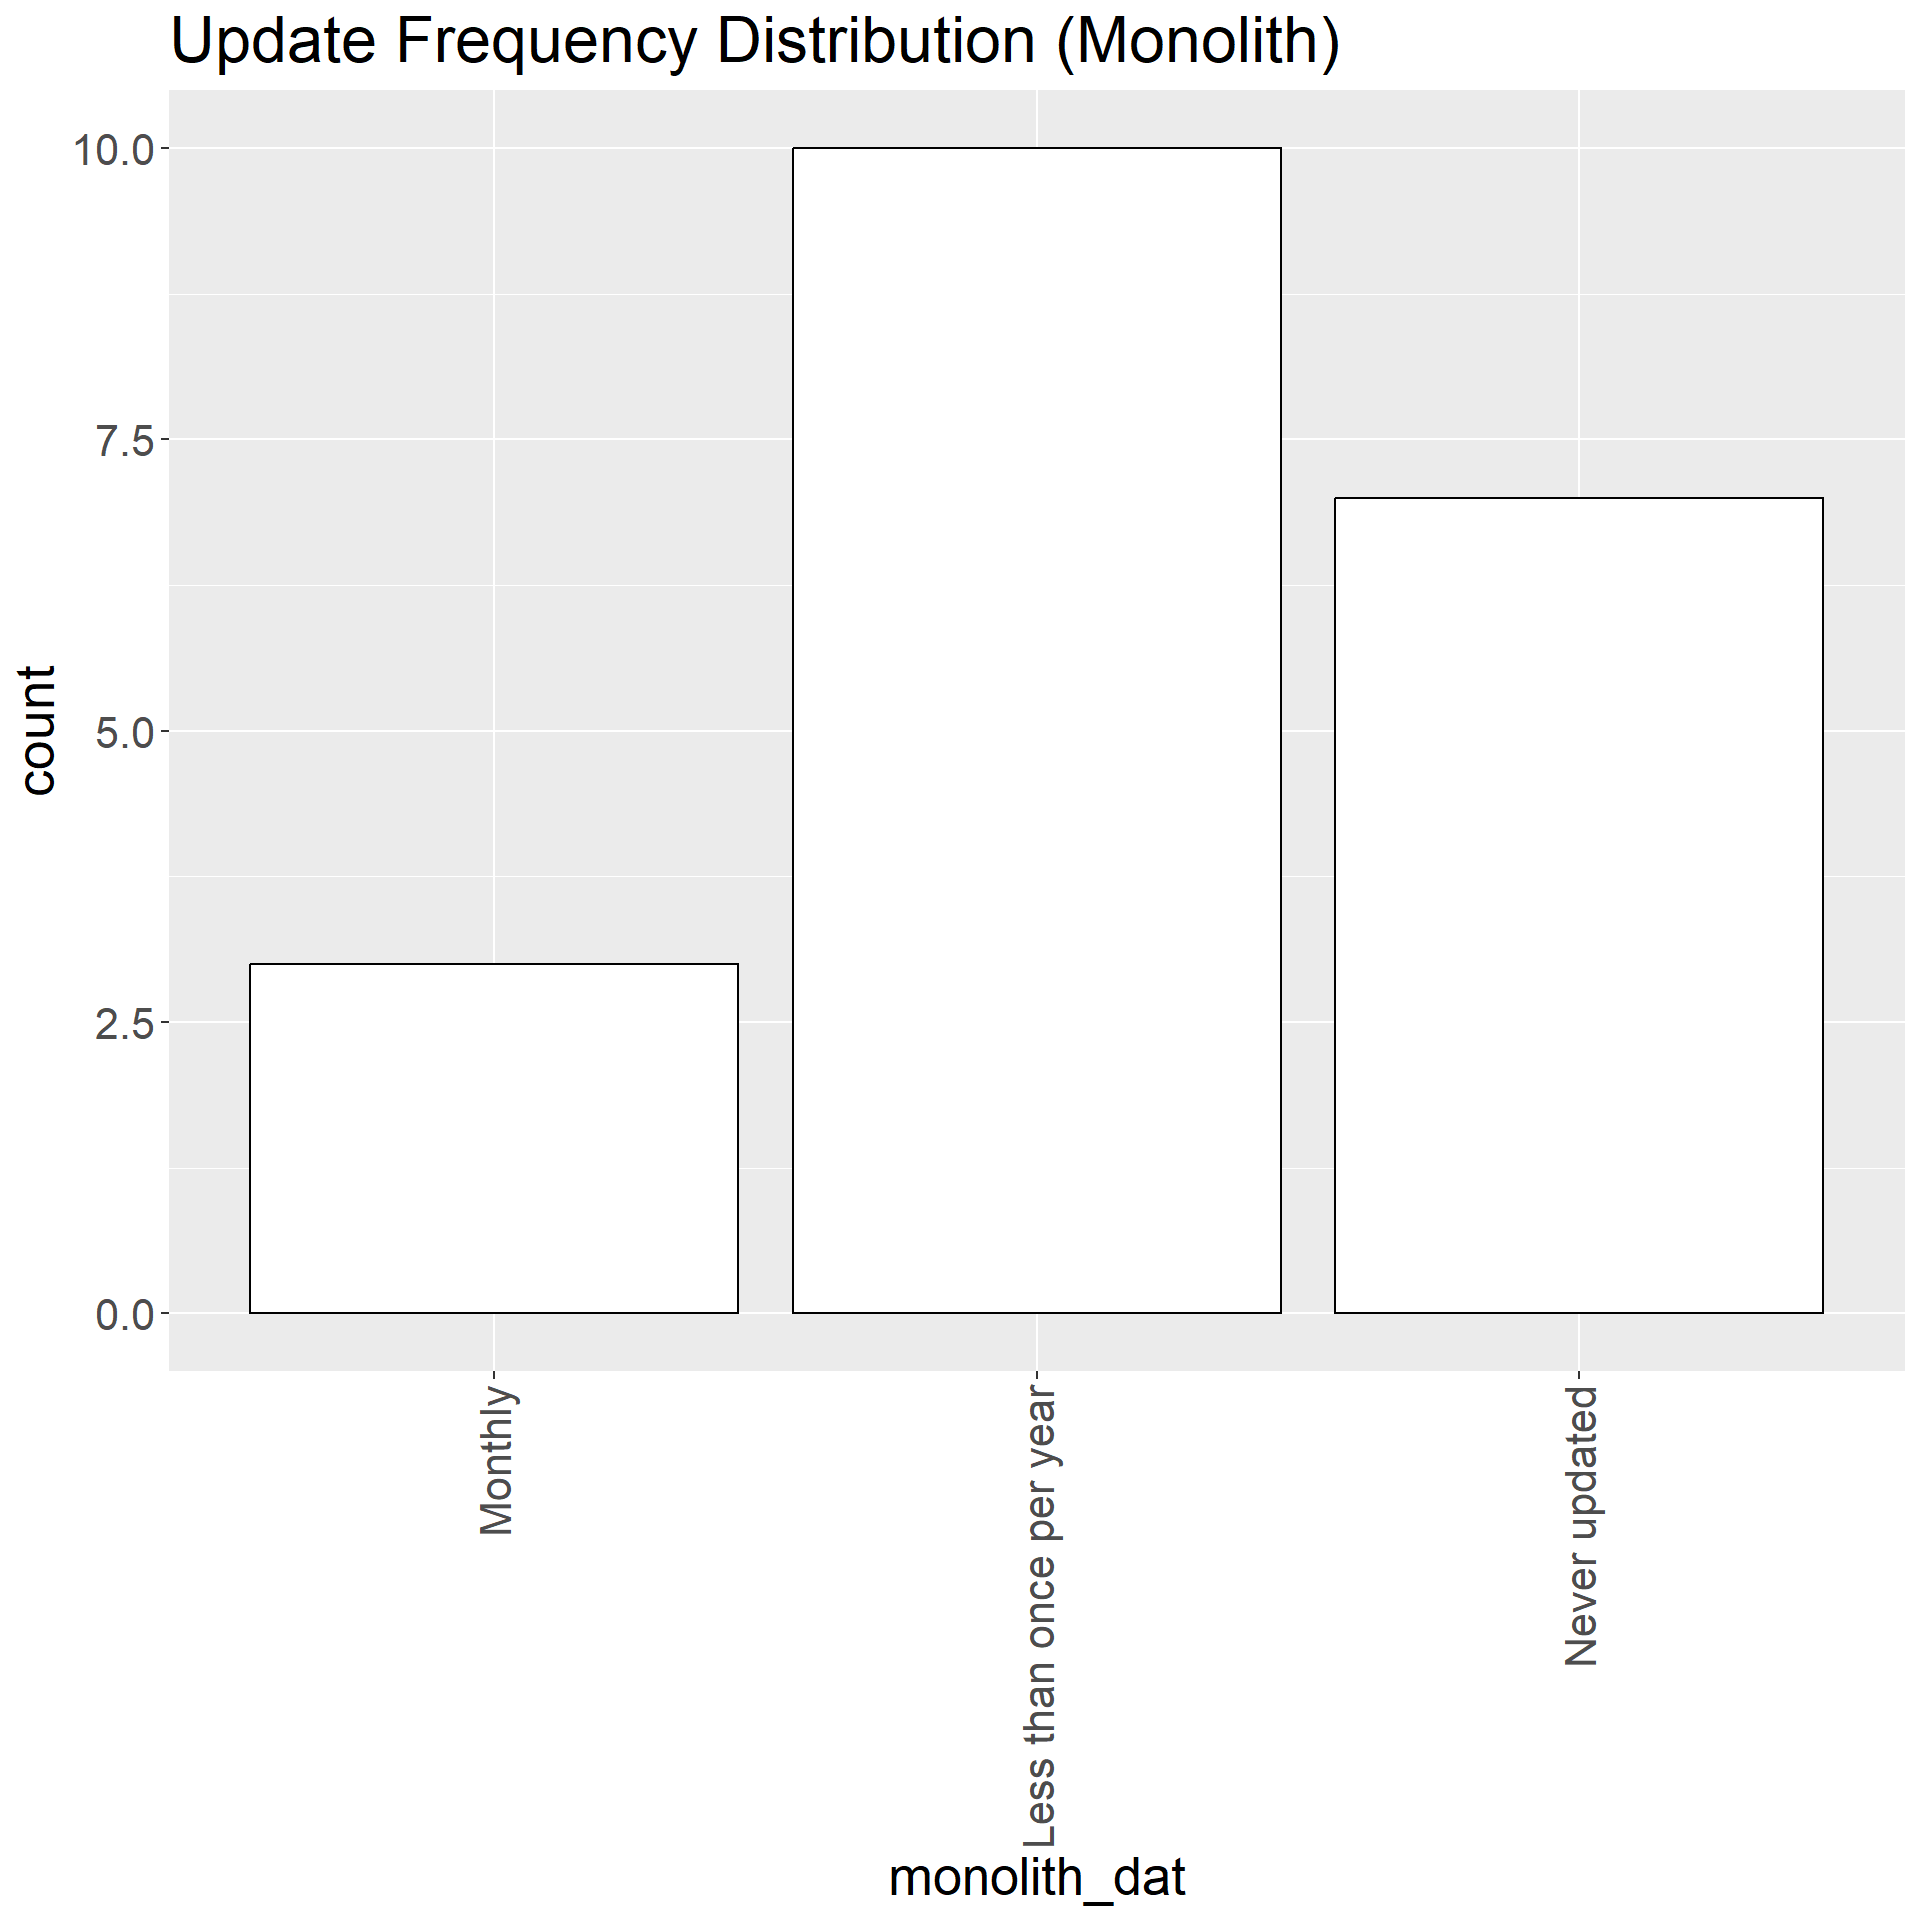
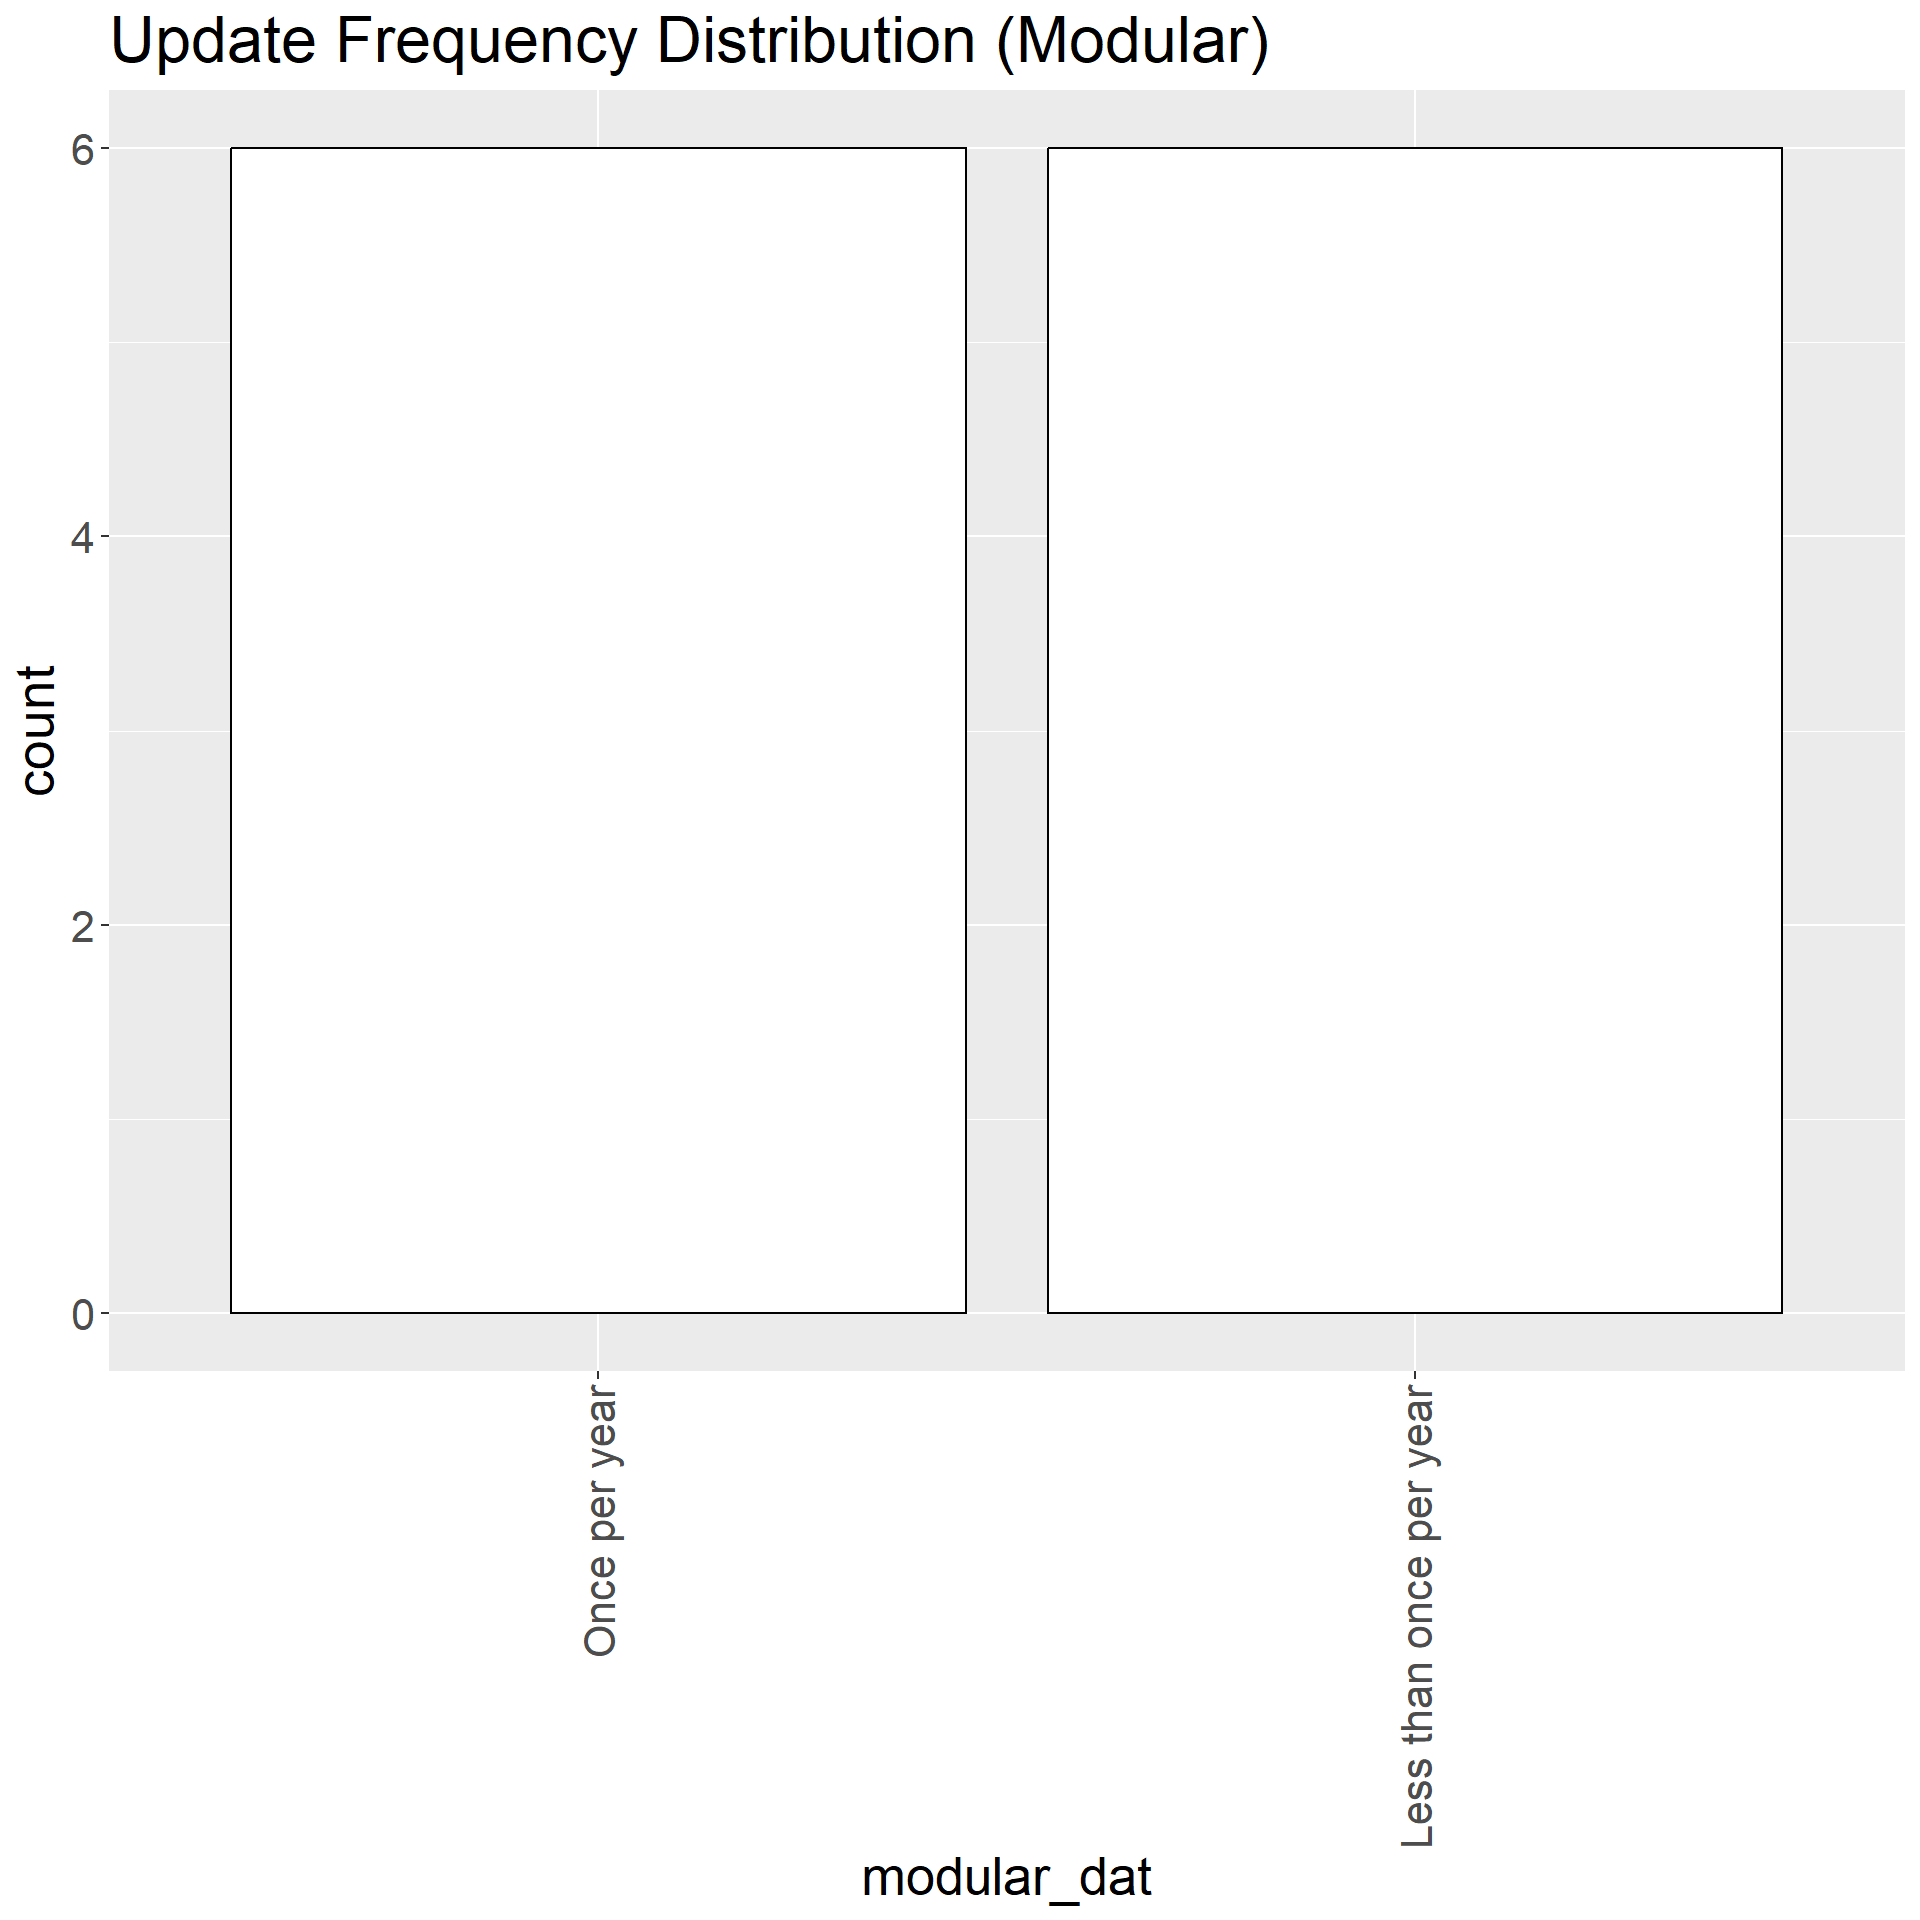
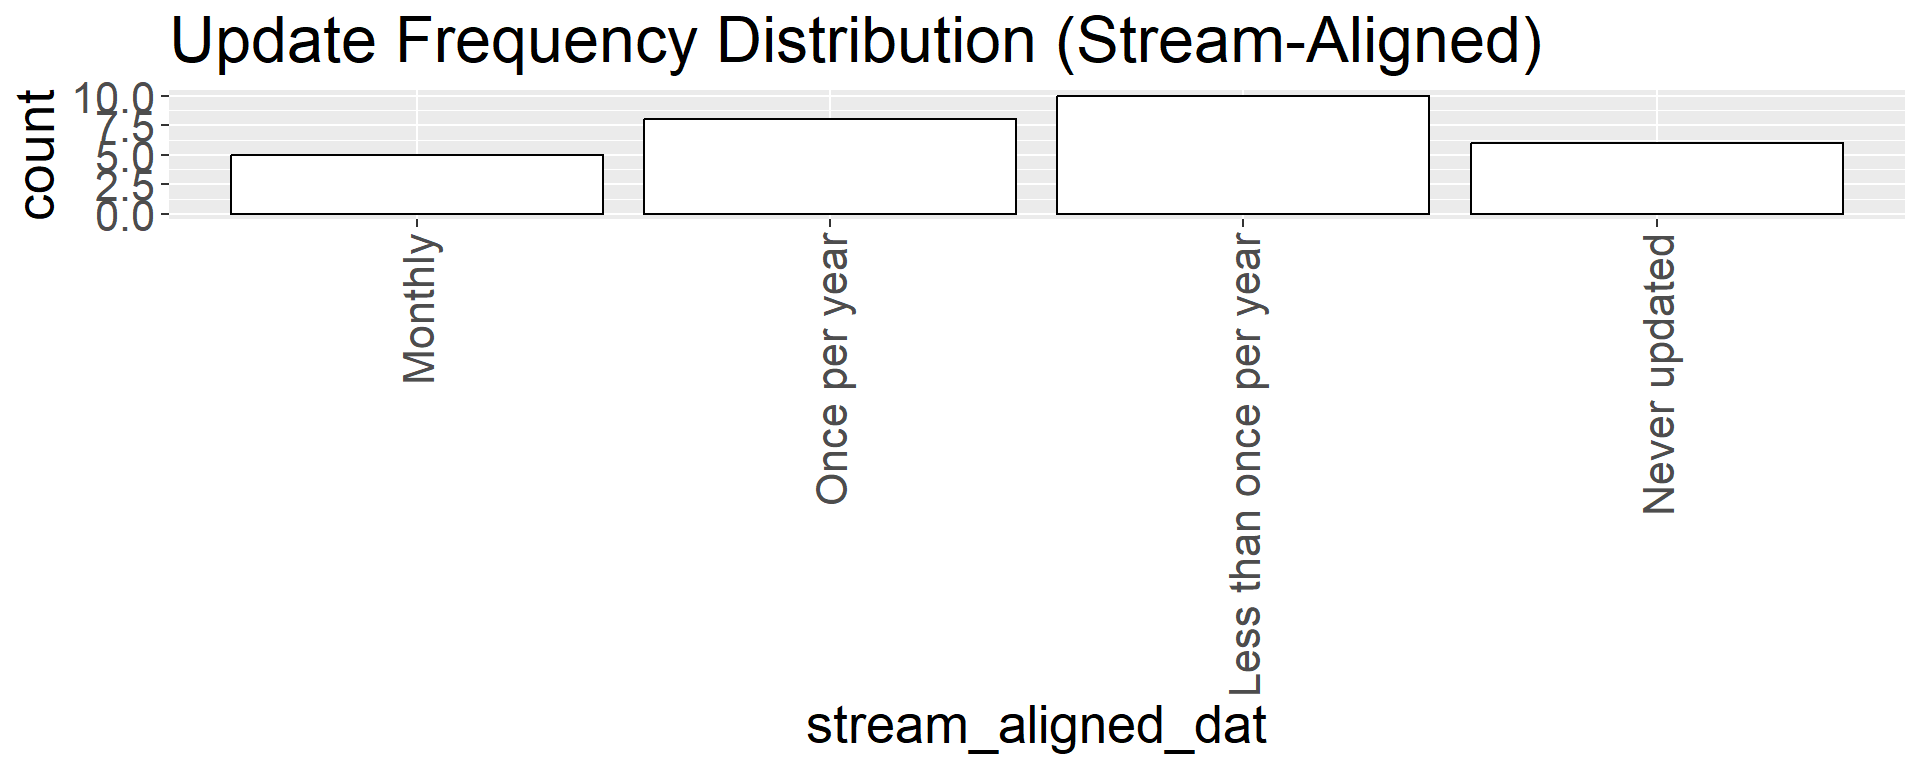
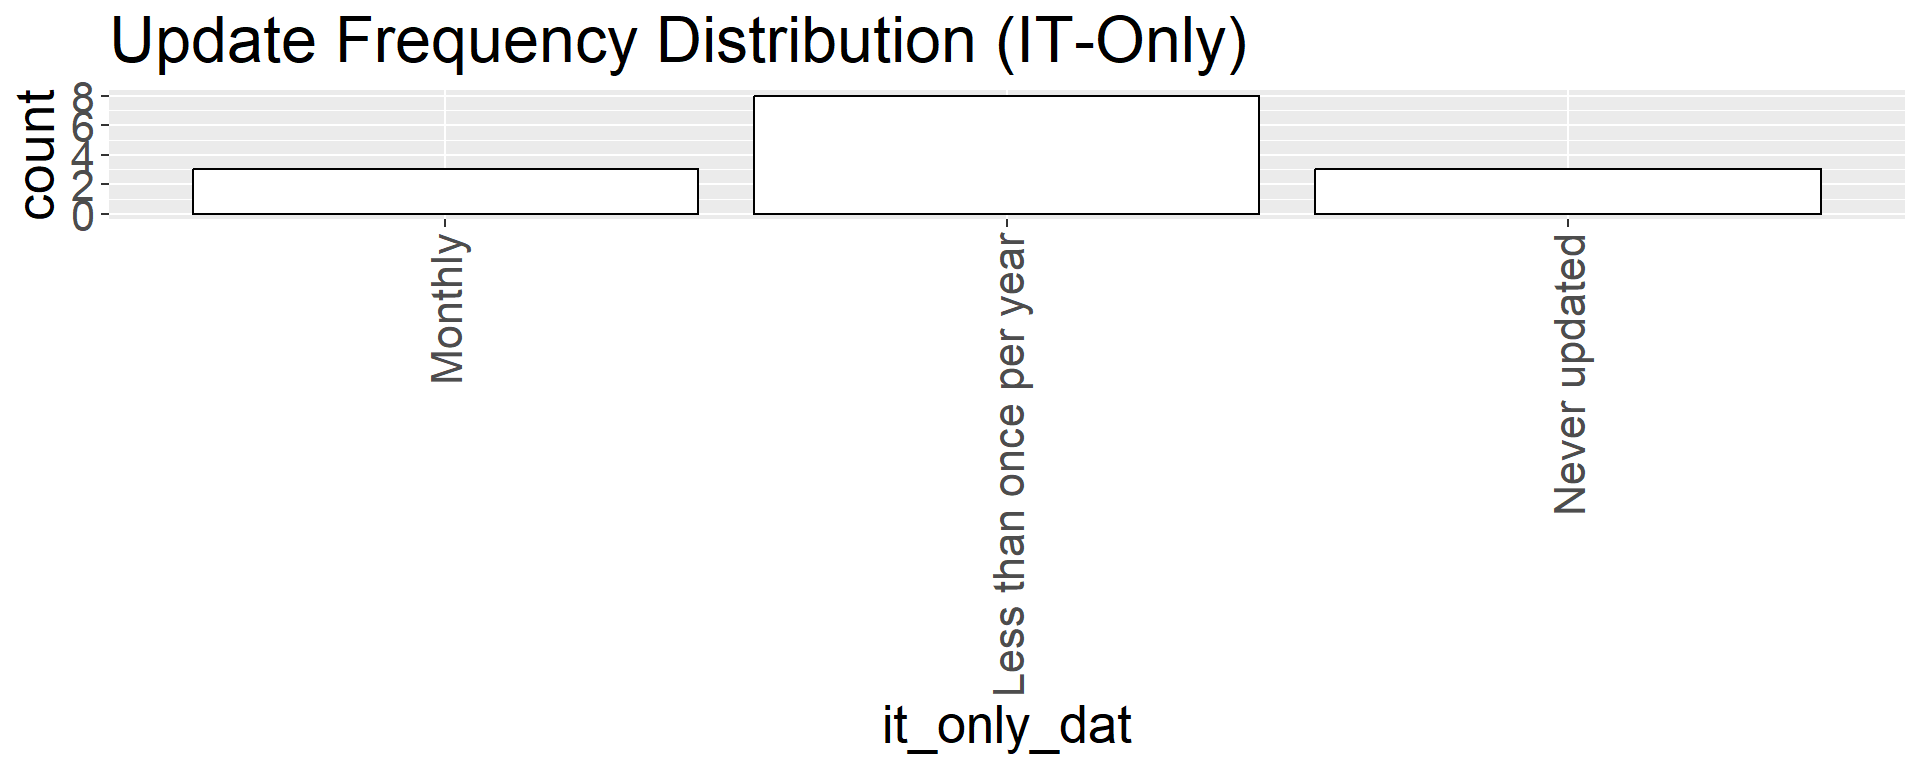
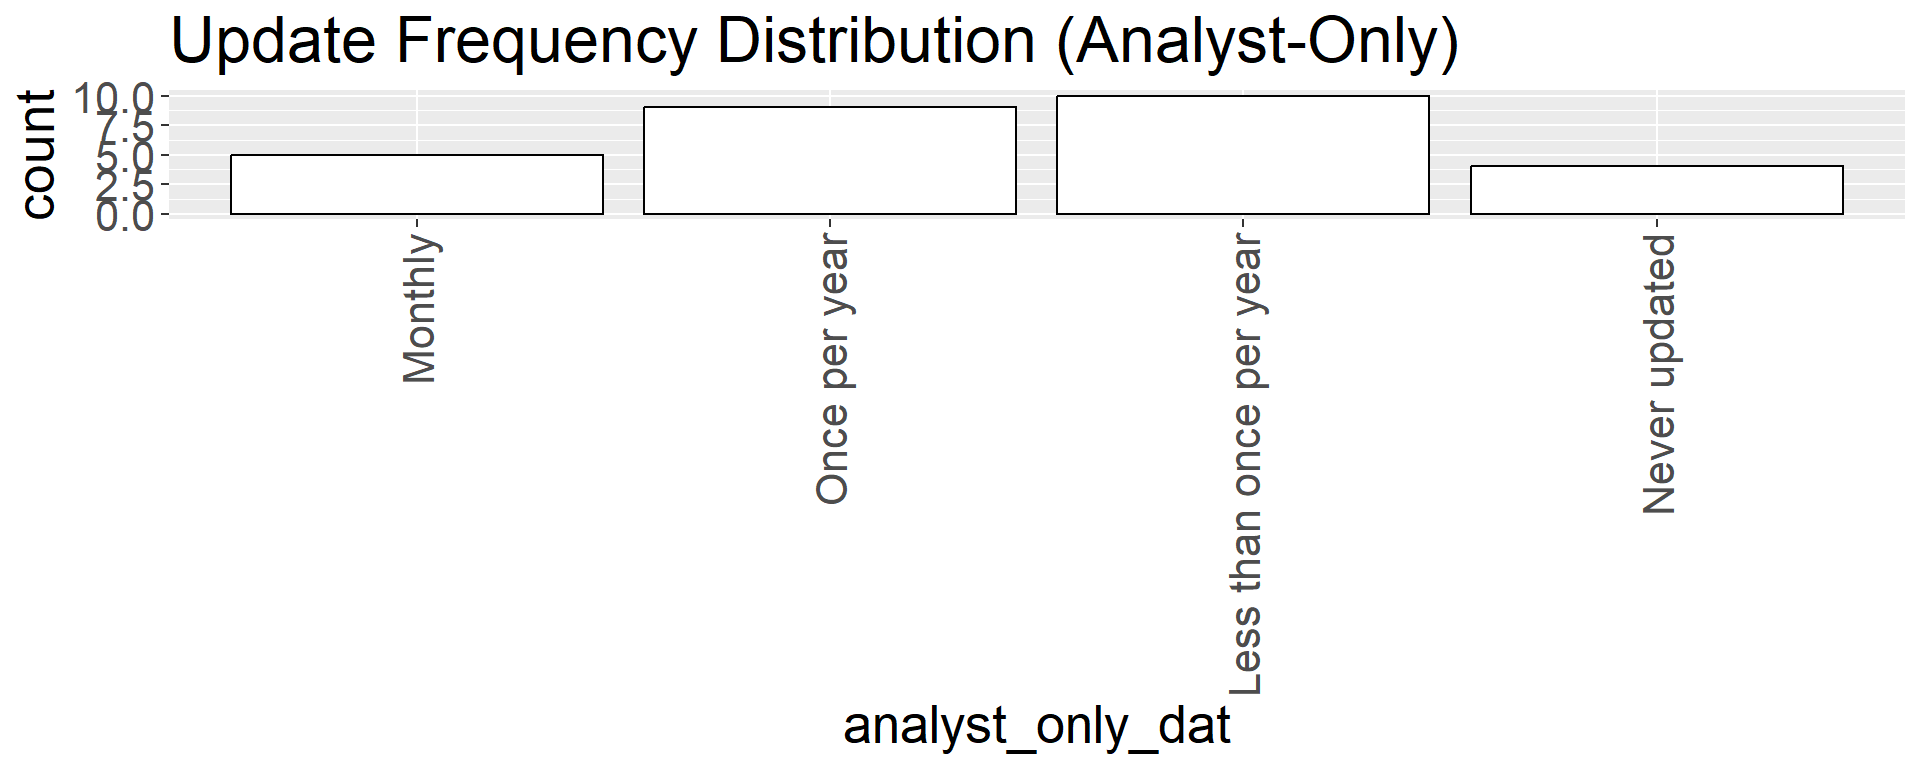
Results - Update Frequency
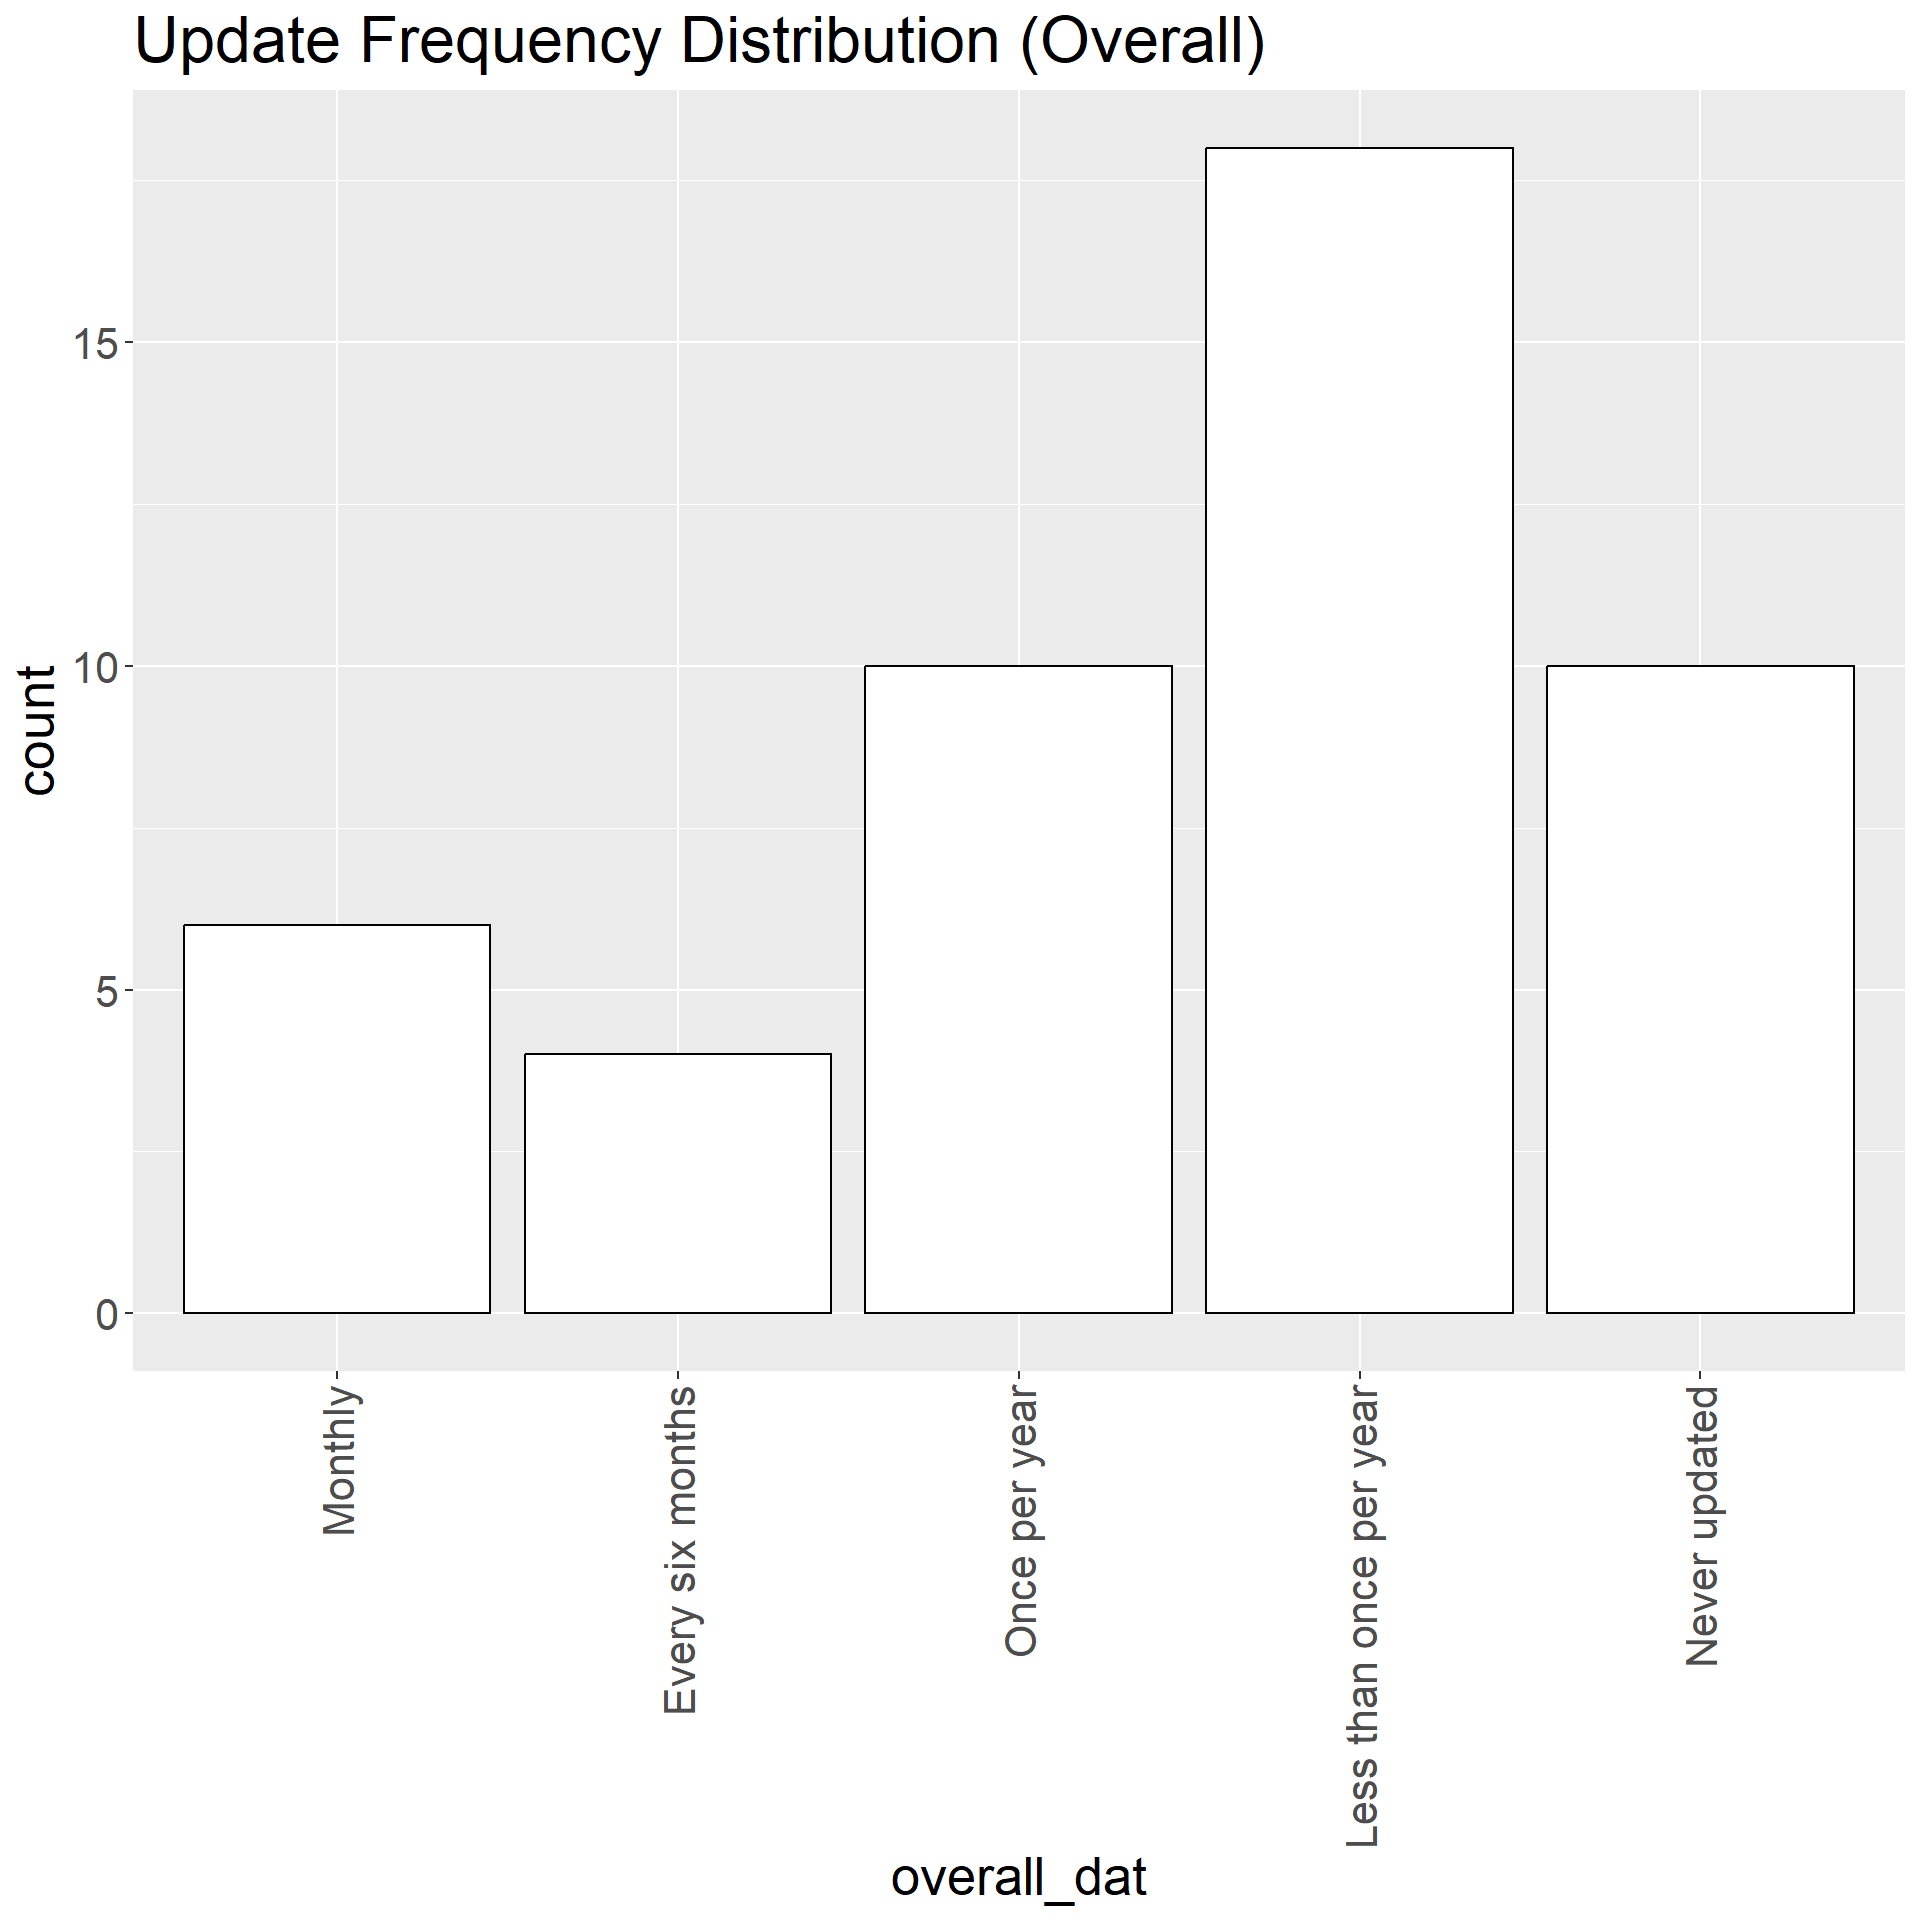
10 respondents never update the majority of systems
Monolithic systems more likely to never be updated than modular systems.
IT-Only teams more likely to update systems frequently than other team types.
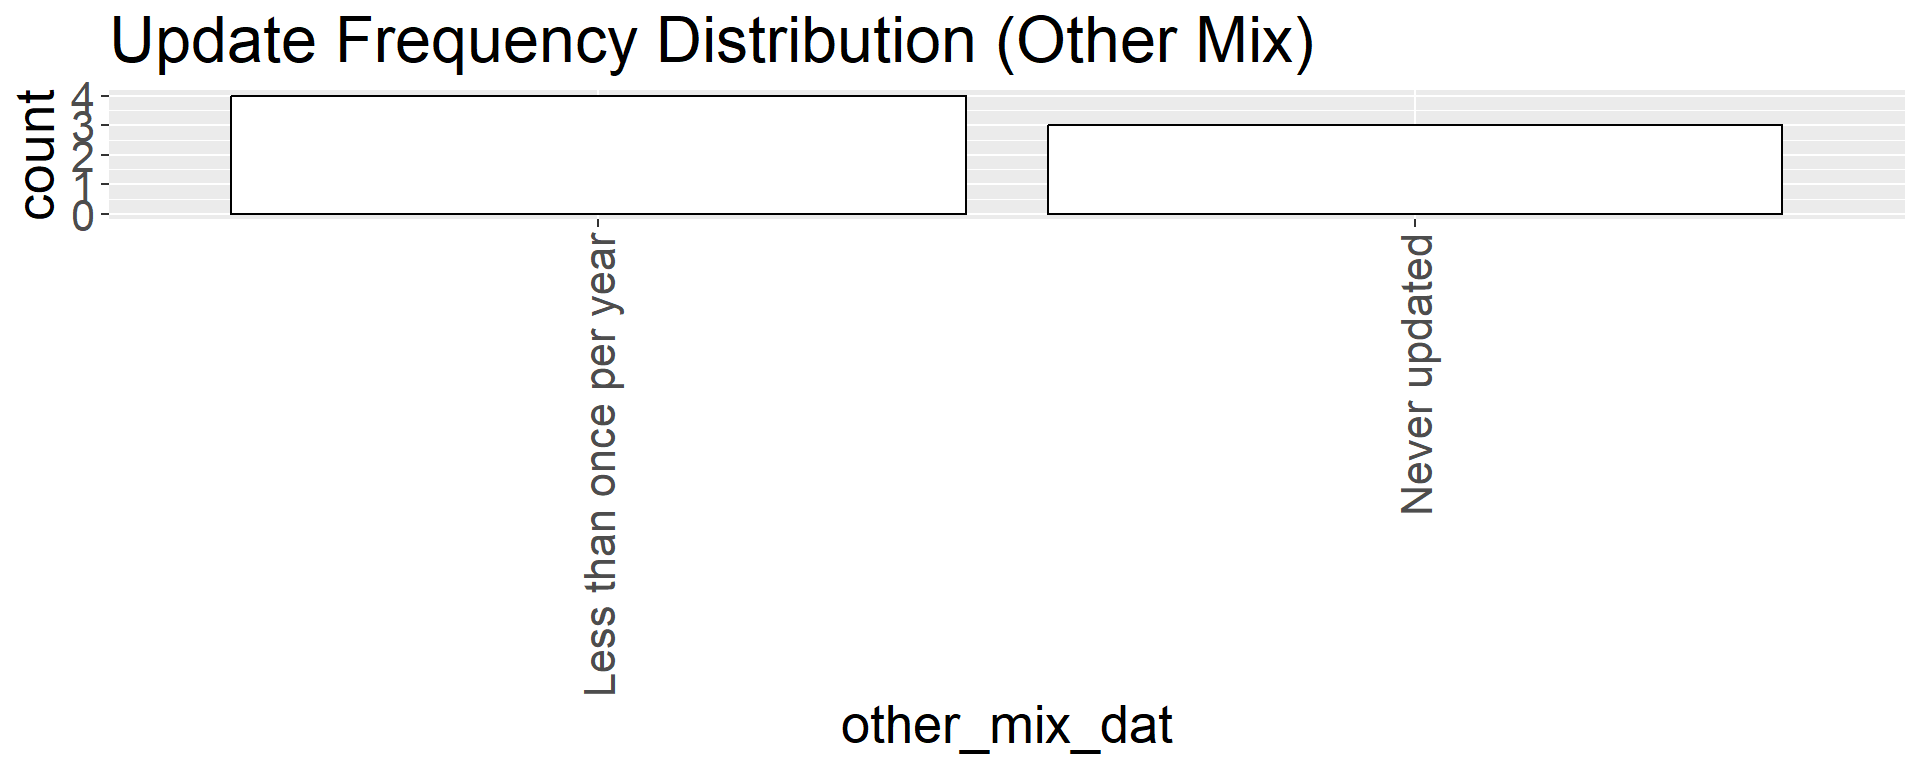
Other Mix teams most likely to never update or update very infrequently.
All team types reported multiple
Never updatedanswers.NSOs that use ADS have 7 respondents who update at least every six months and 16 respondents who update once per year or less.
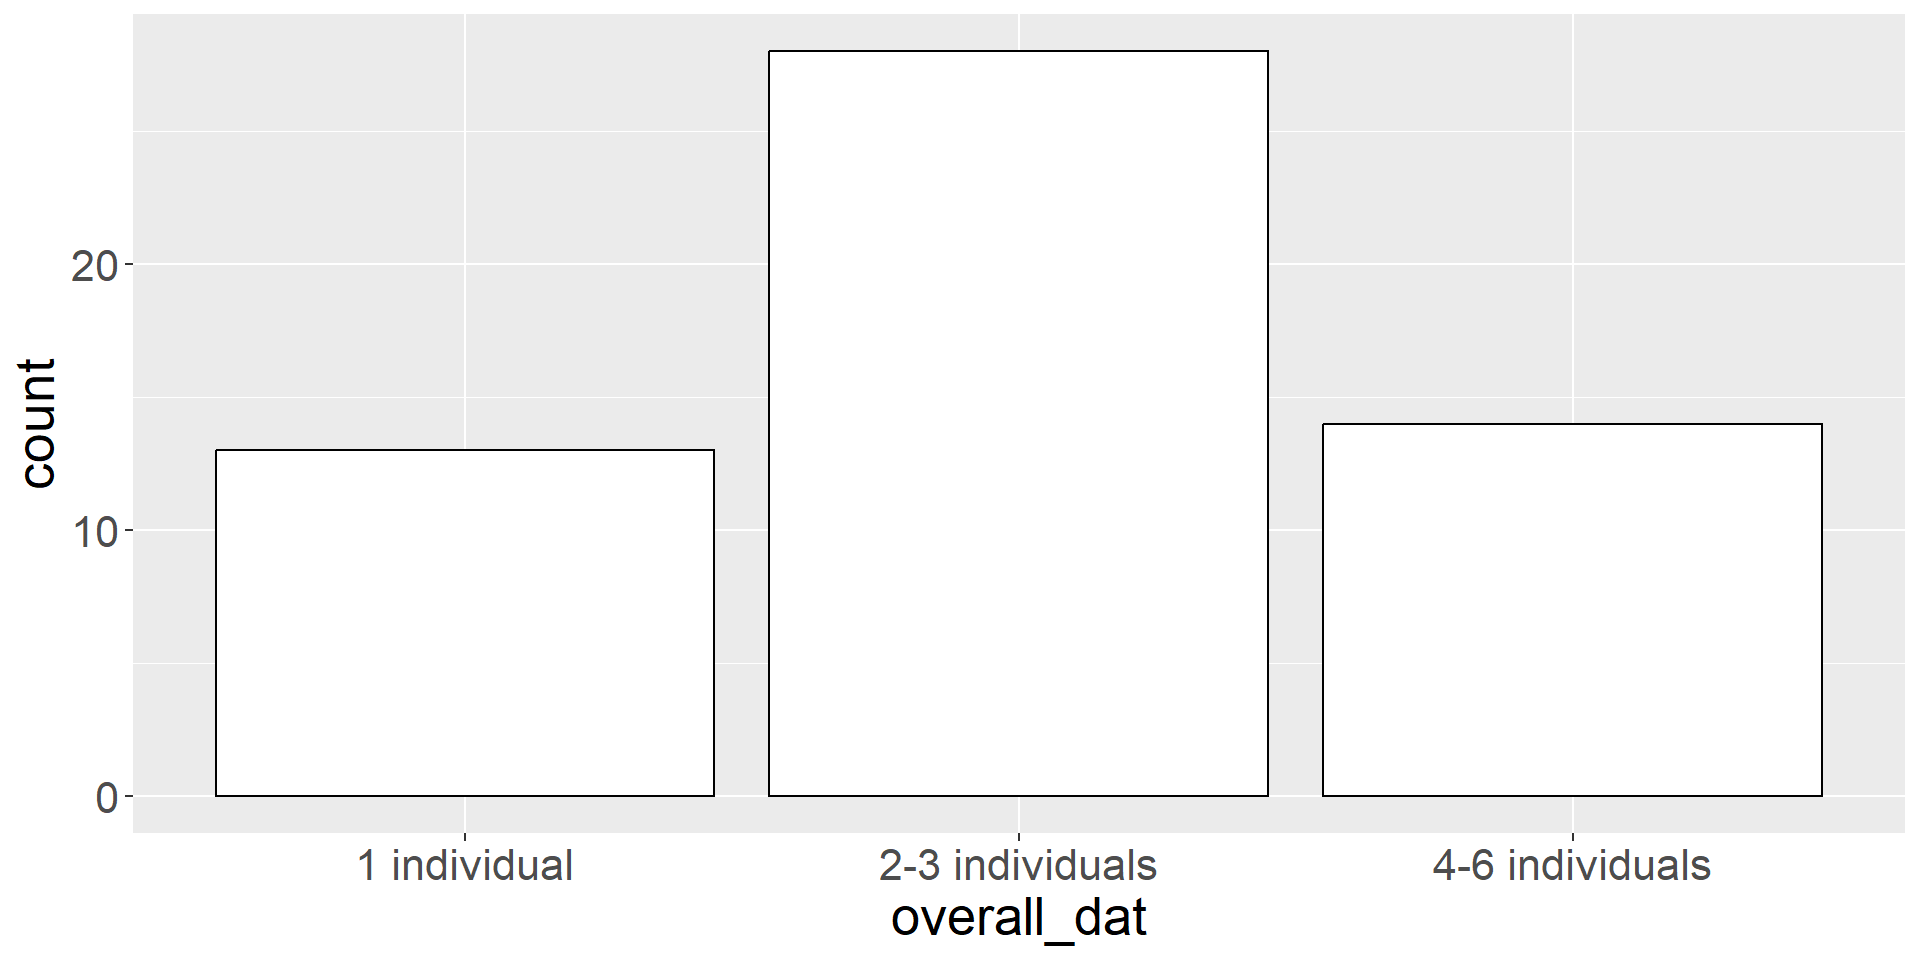
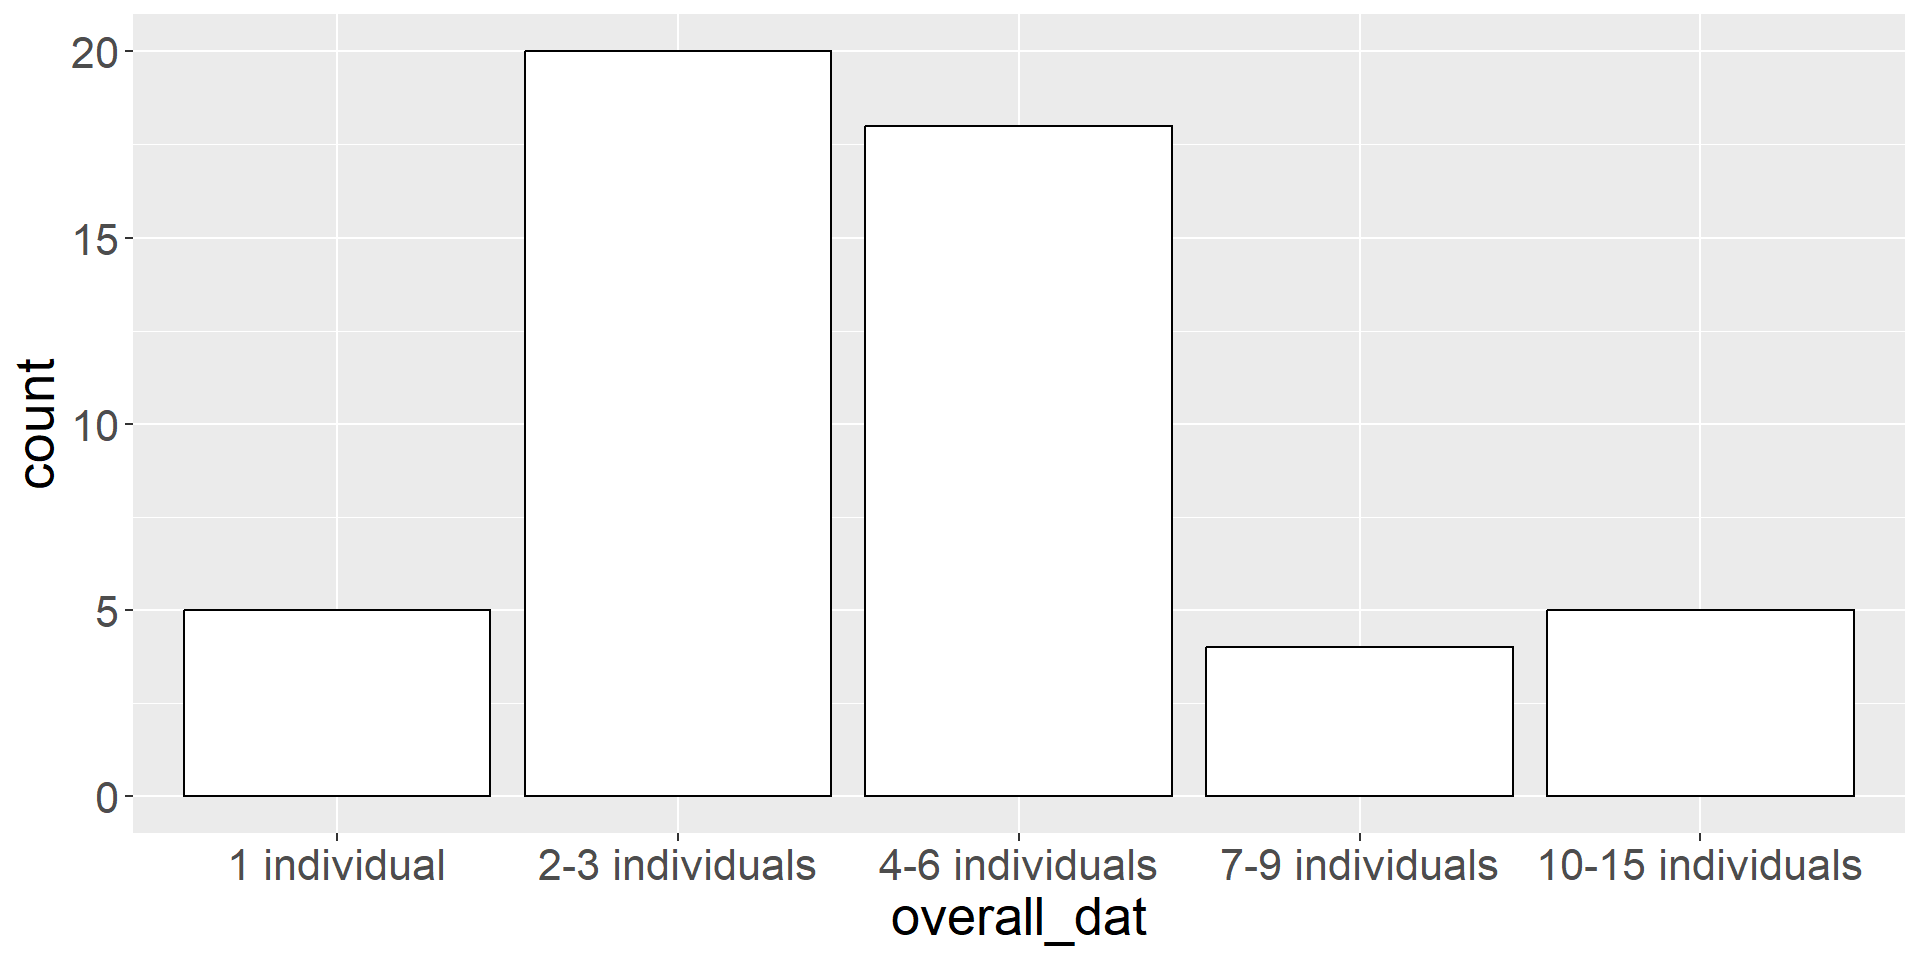
Results - Number of Individuals
- Large changes required more people.
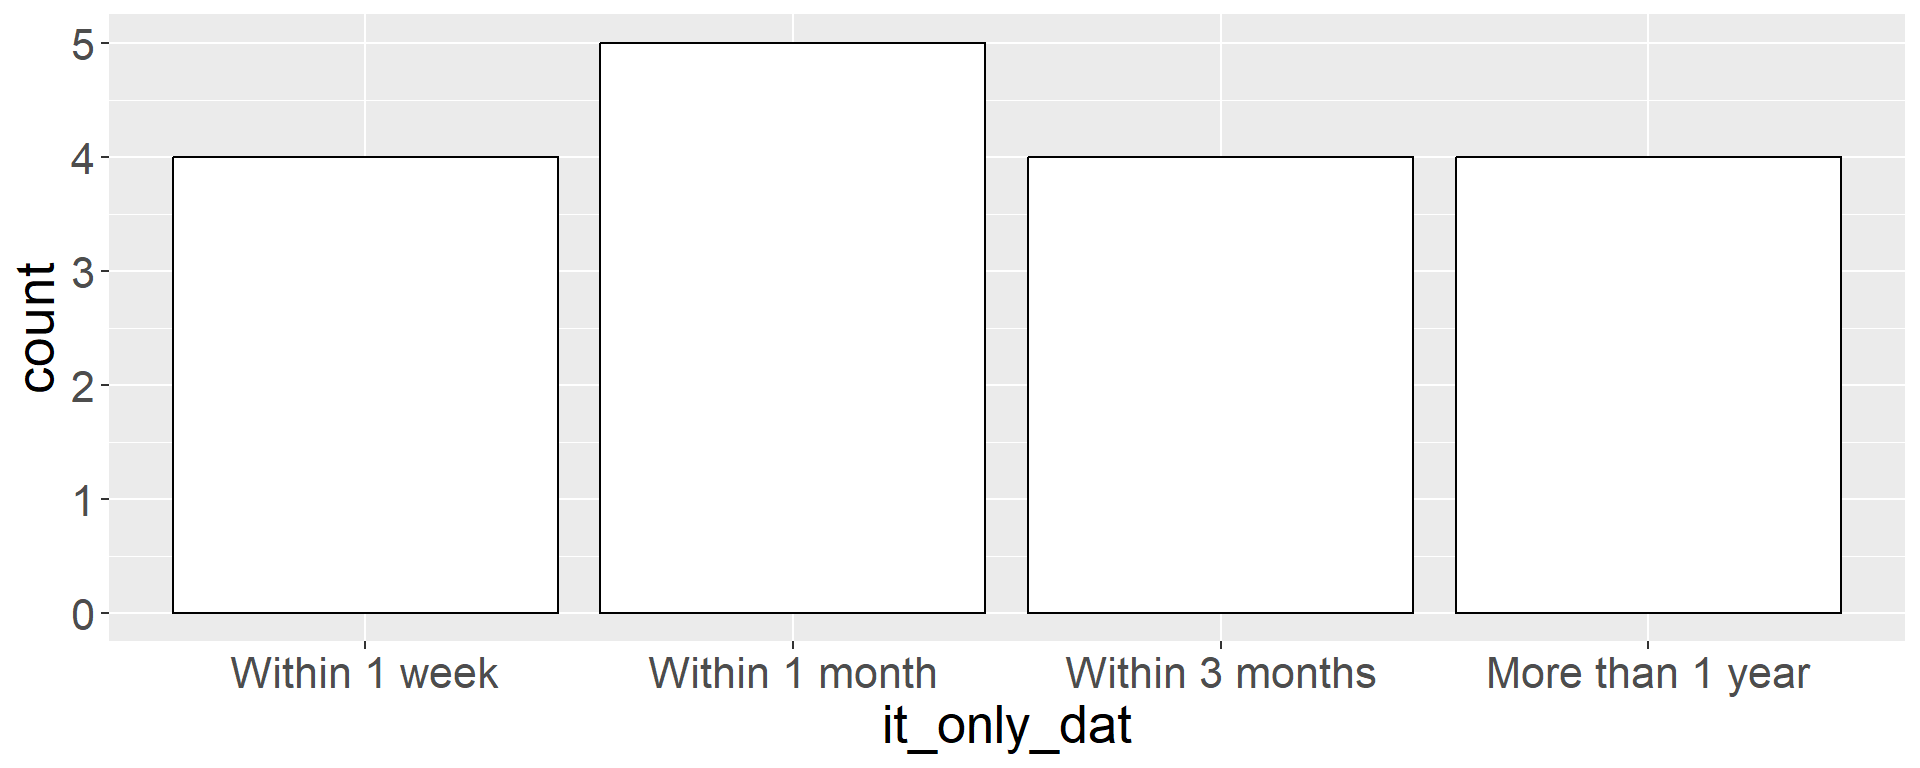
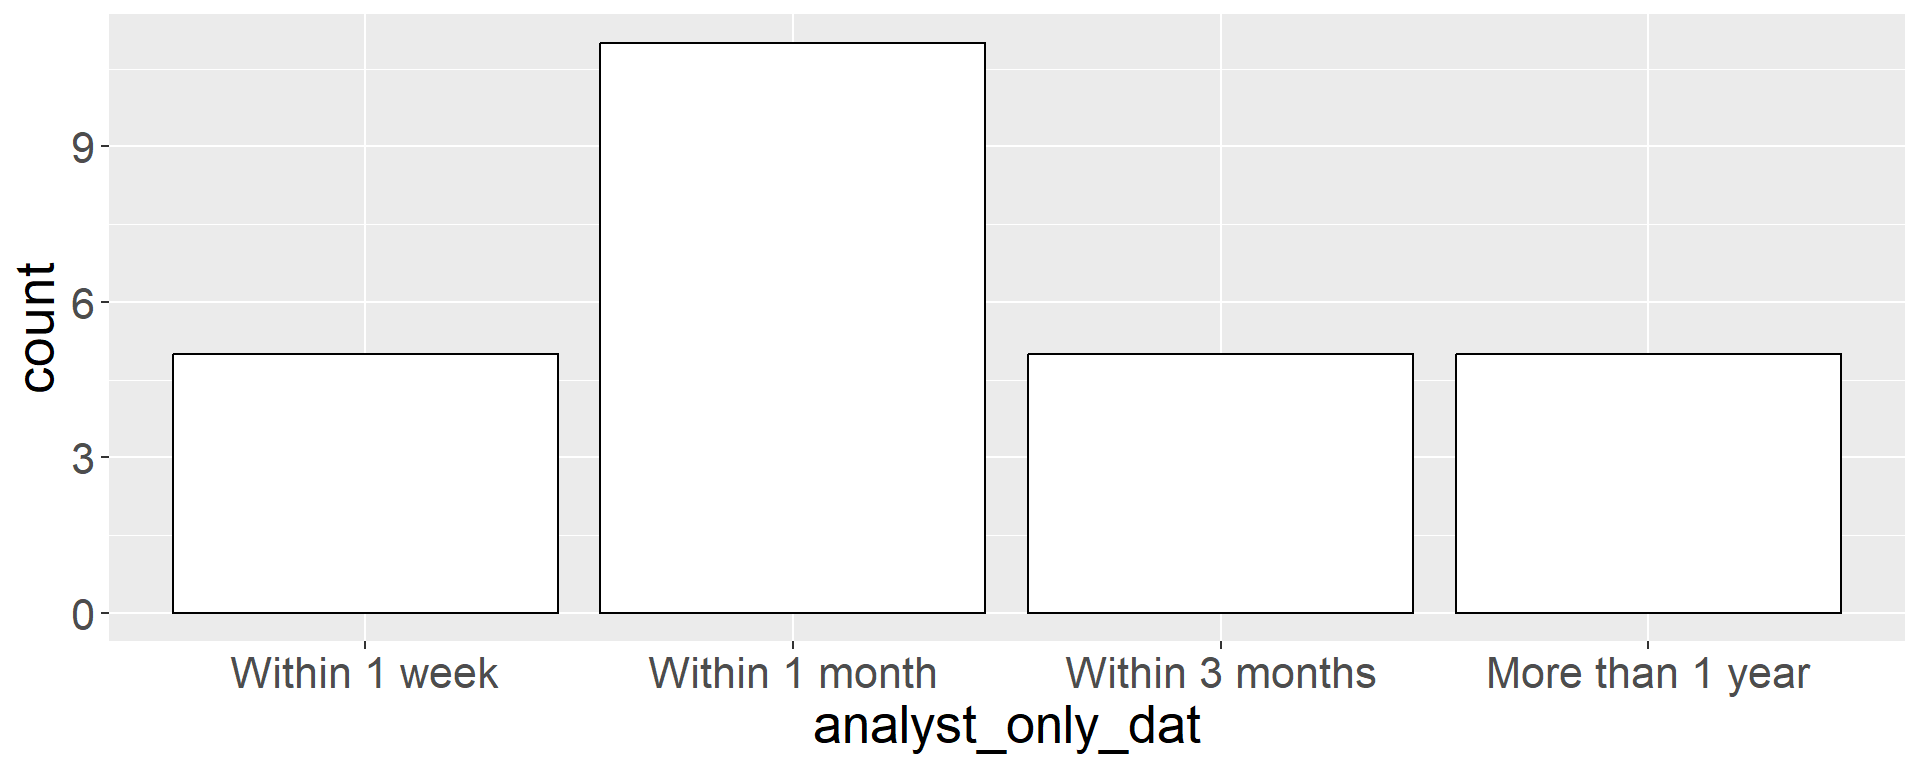
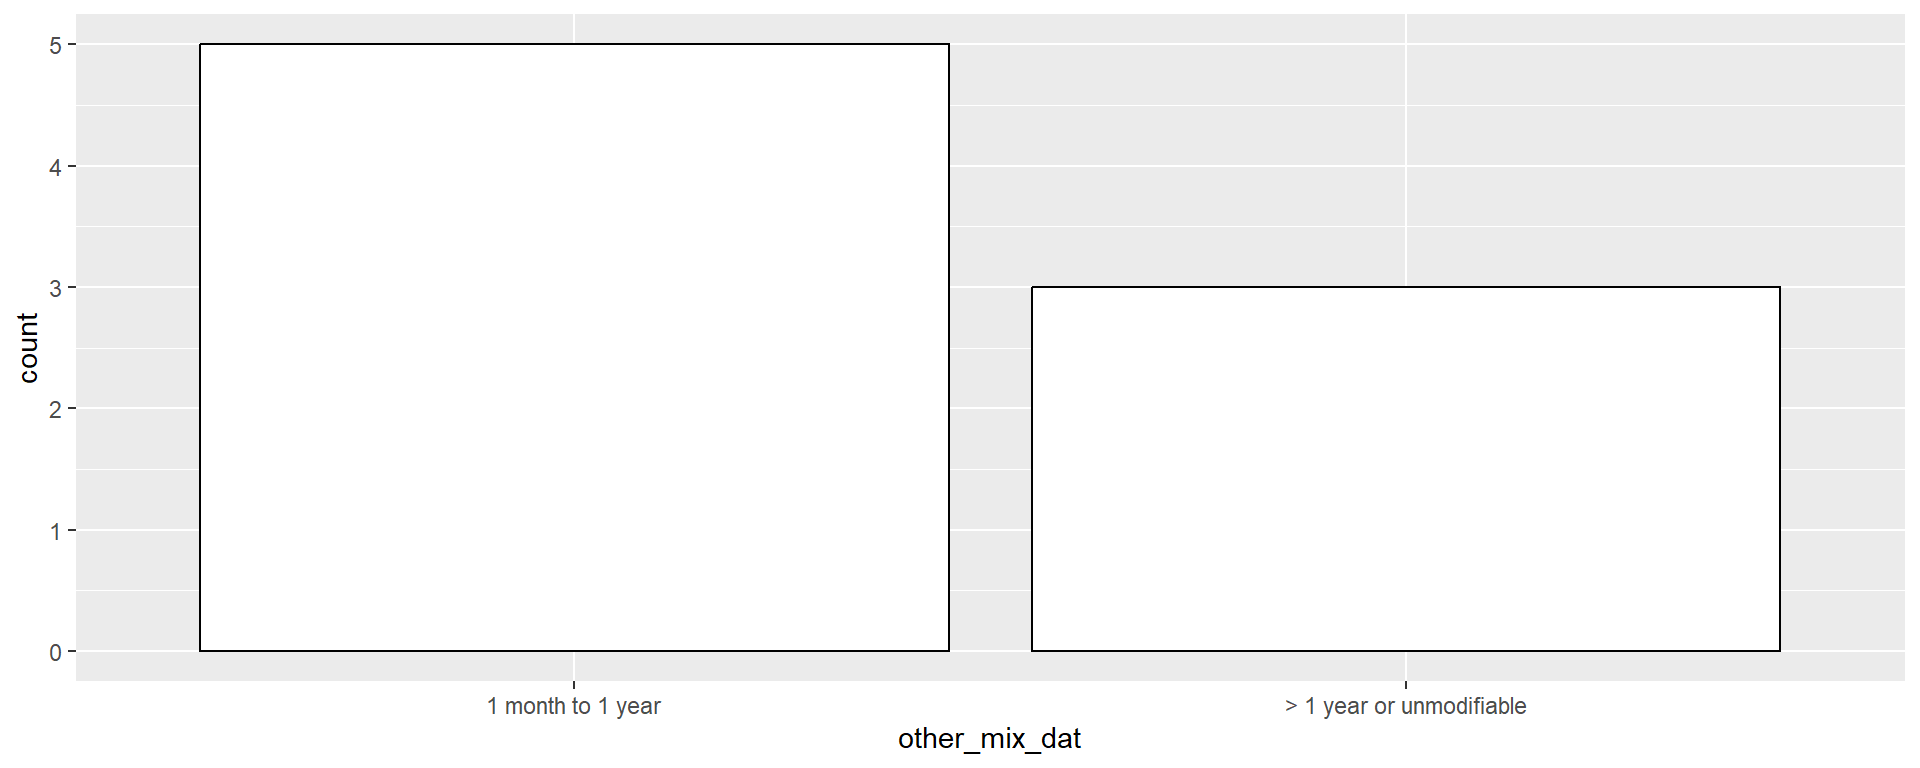
Results - Lead Time
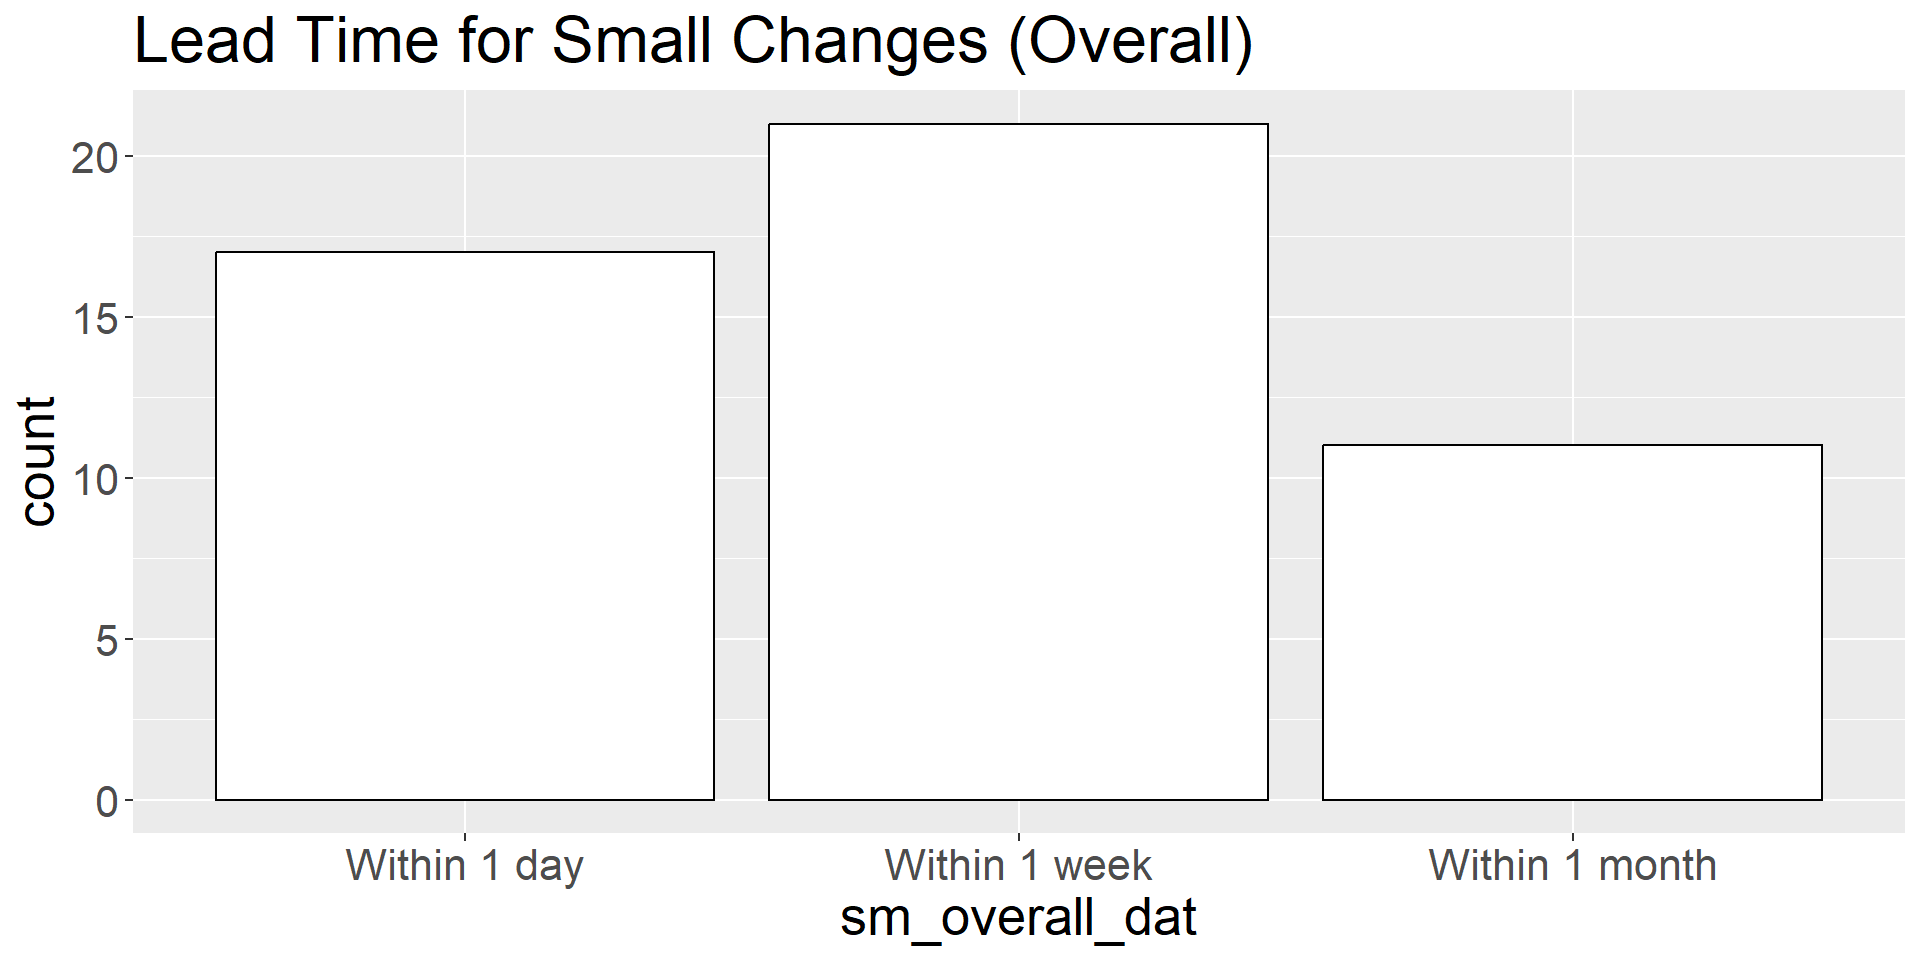
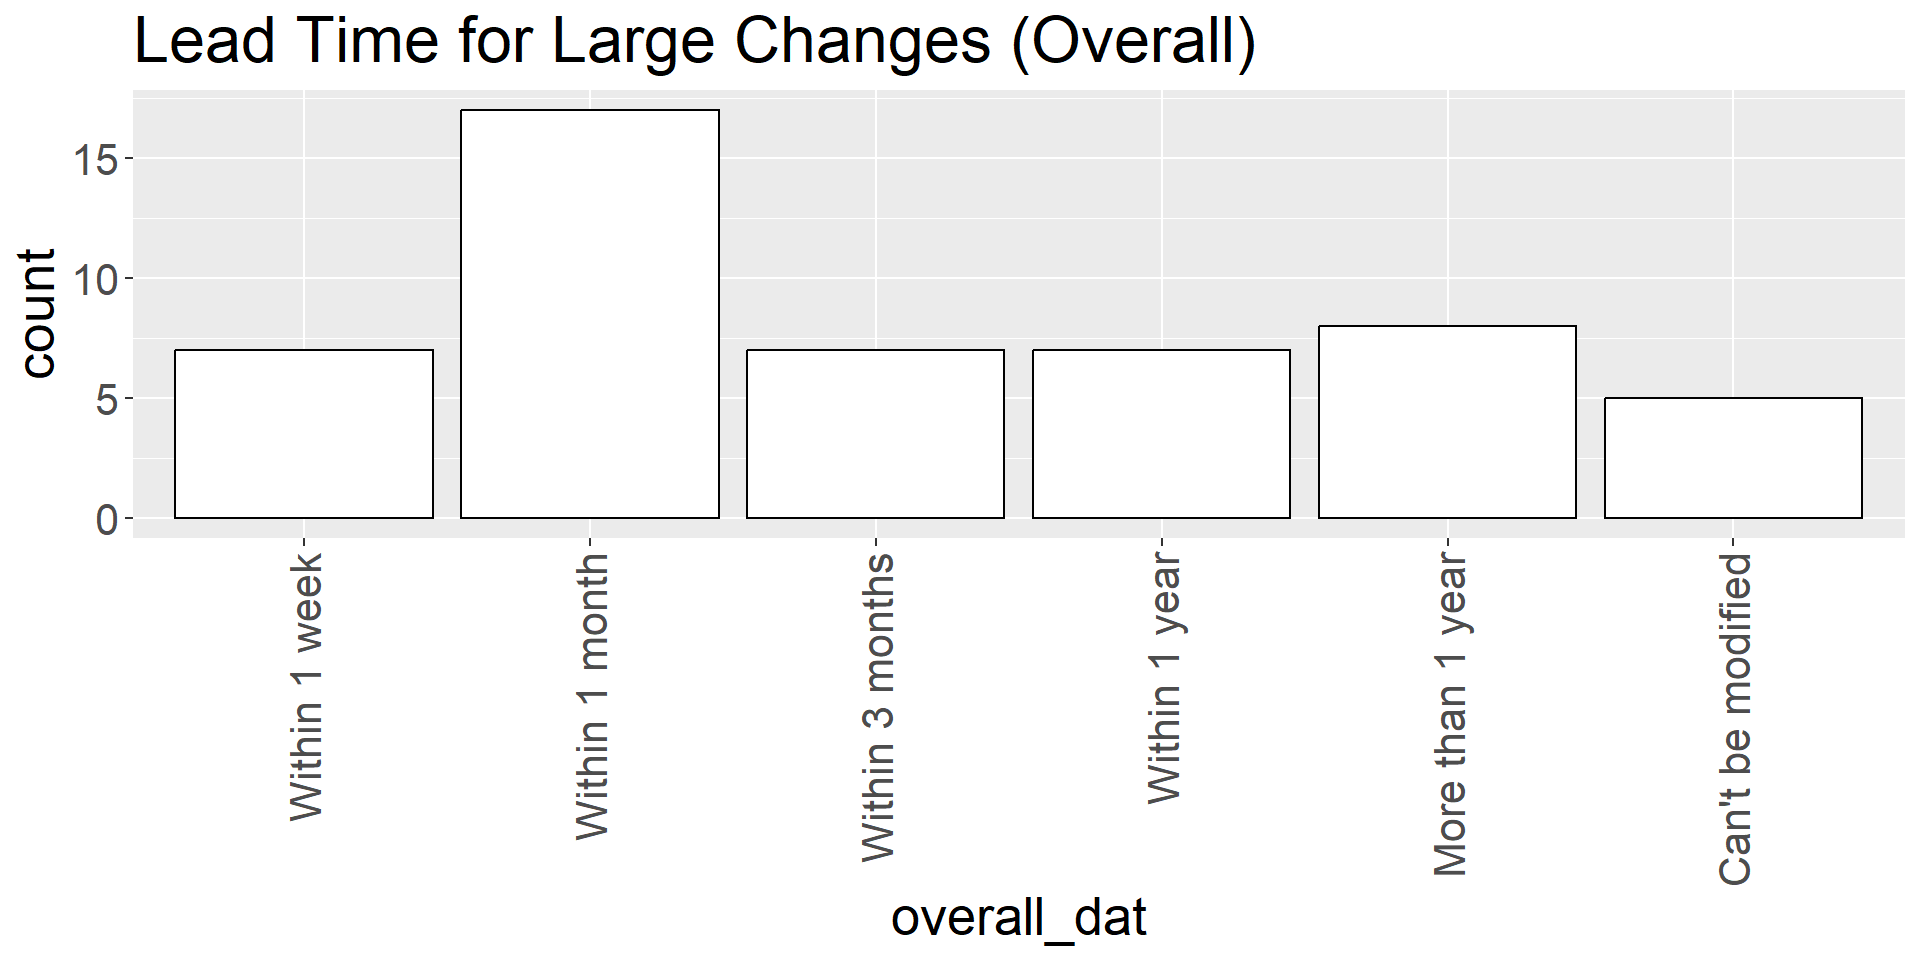
Lead time: the amount of time required to get an end-to-end change to a CPI Production System implemented.
38 respondents reported lead times of
Within 1 dayorWithin 1 weekfor small changes.11 reported lead times of
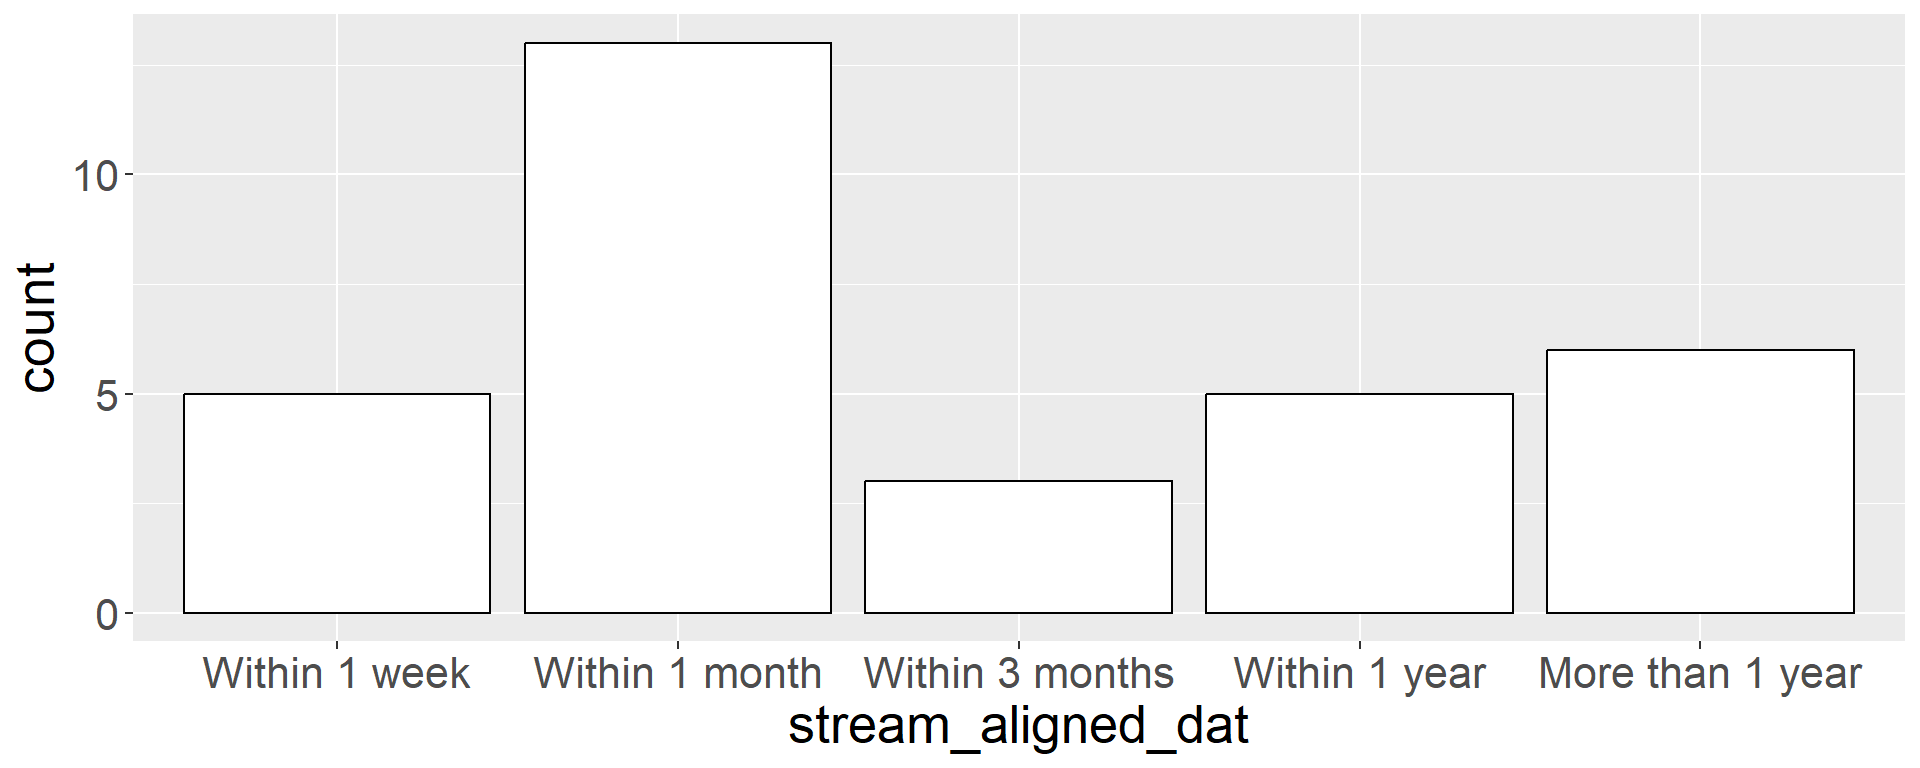
Within 1 monthfor small changes.Lead time responses for large changes range anywhere from
Within 1 weektoCan't be modified.Takeaway: Modest changes with short lead times are less risky than substantial changes with long lead times.
Results - Alternative Data Source (ADS) Usage
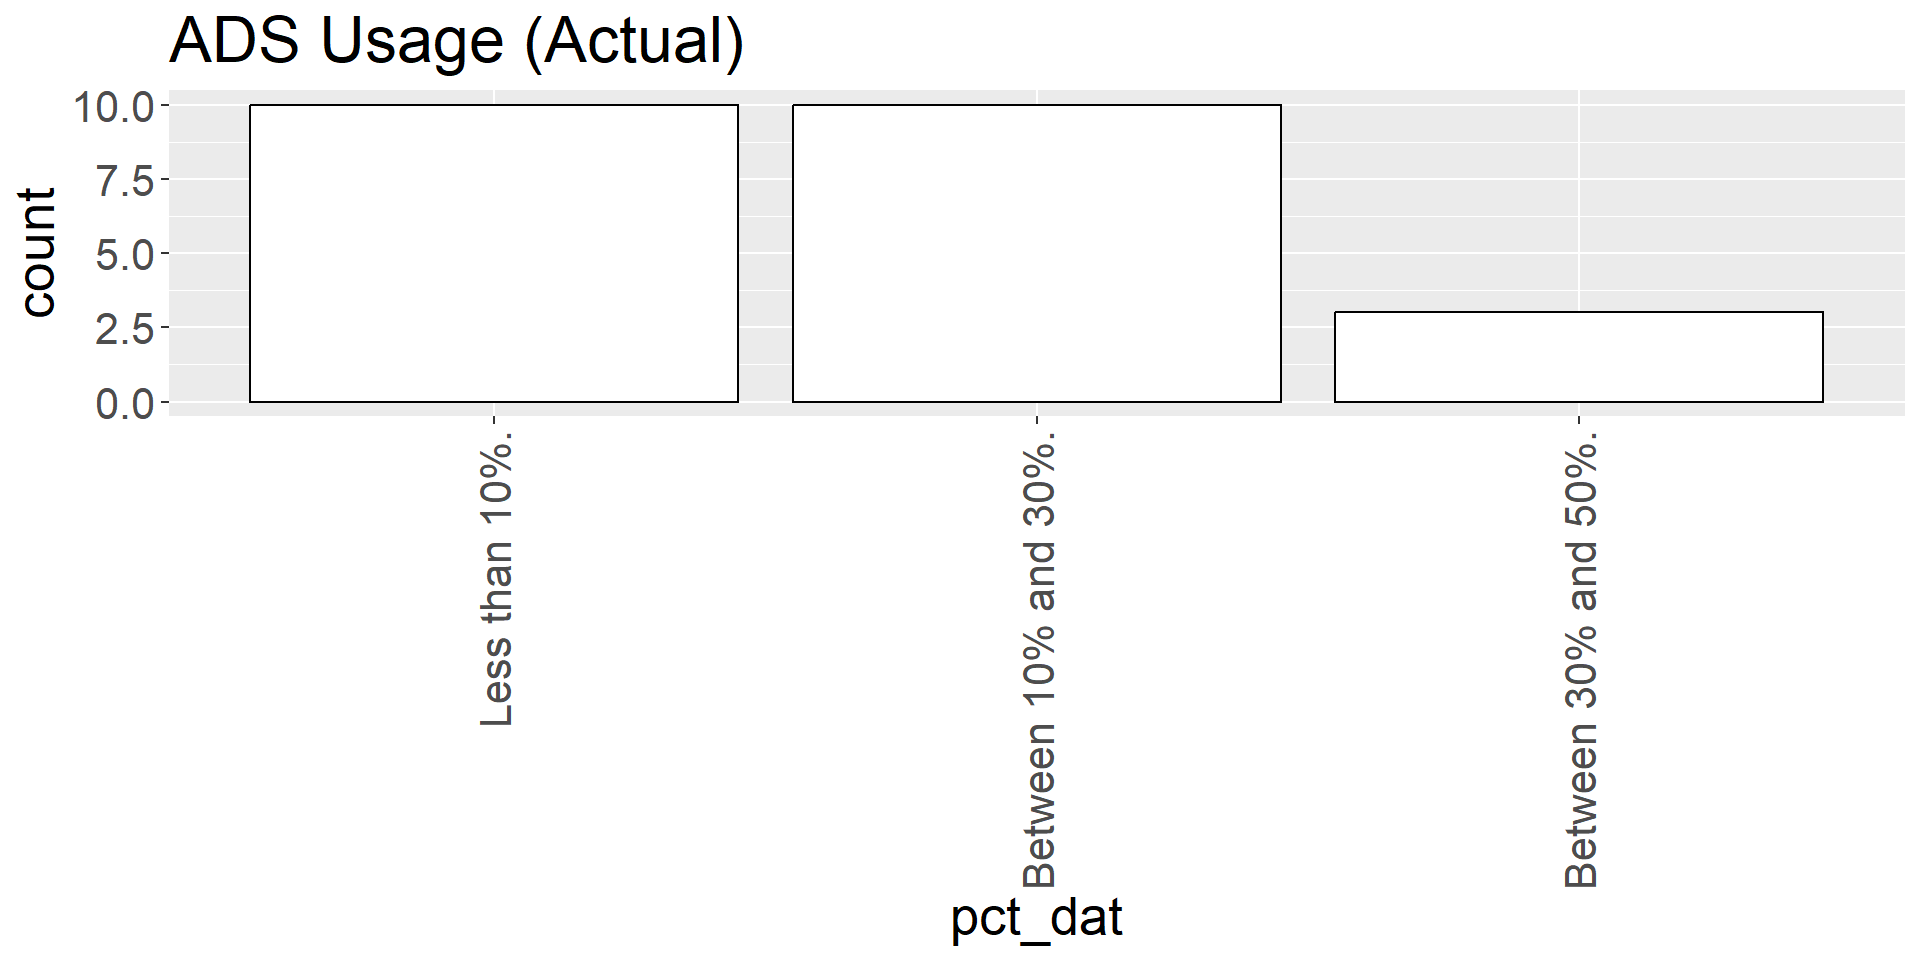
Just under two thirds of respondents don’t use Alternative Data Sources (ADS) at all.
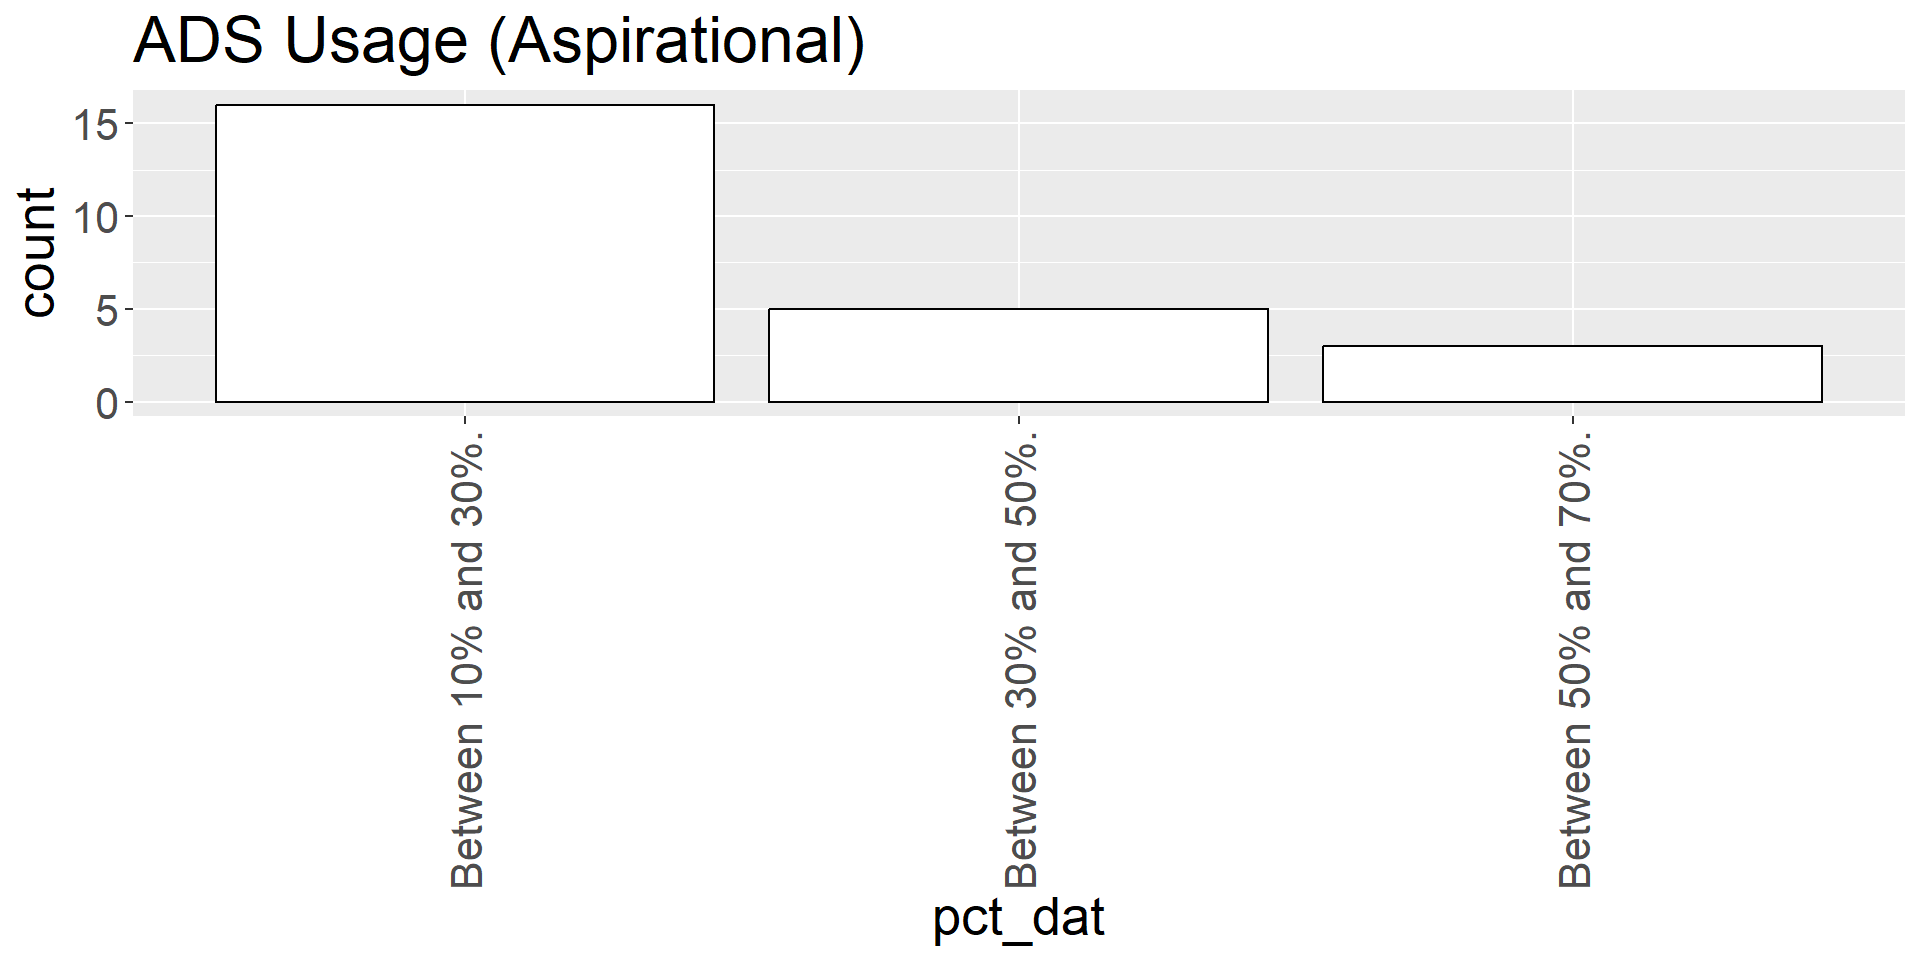
Of those respondents who do not use ADS, most of them would like
Between 10% and 30%orBetween 30% and 70%of their CPIs to be comprised of ADS by expenditure weight.
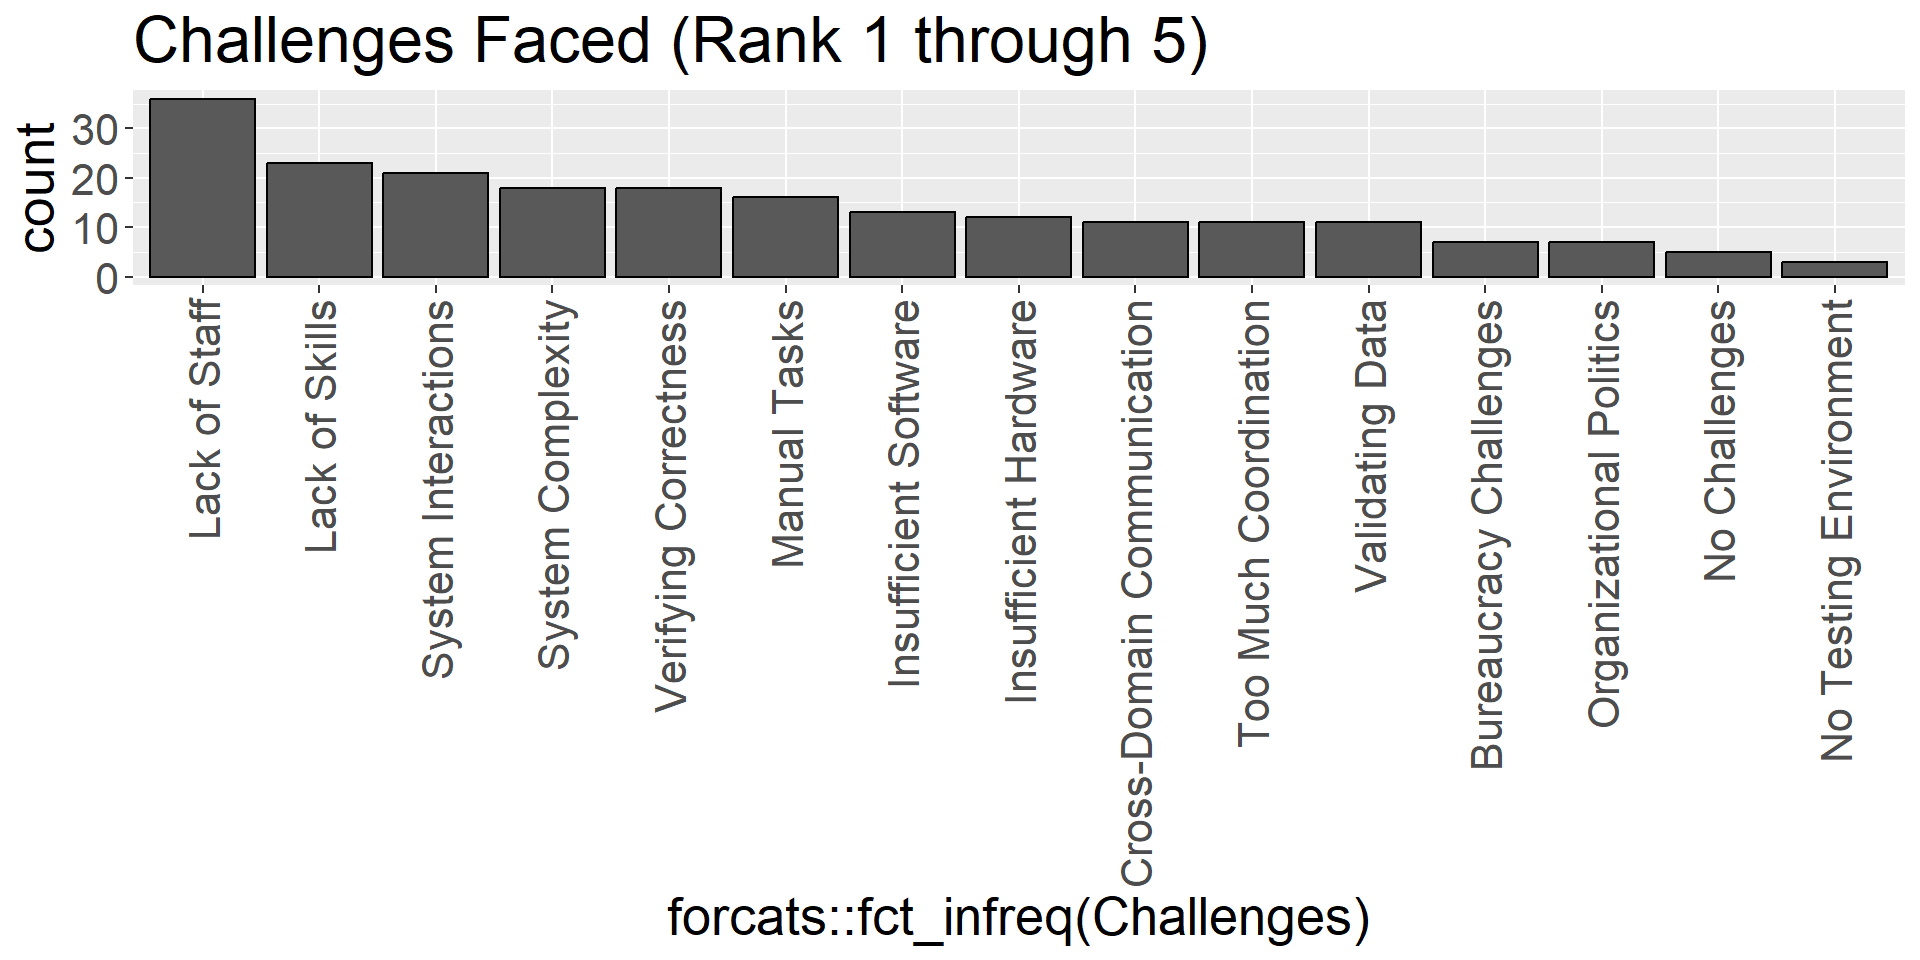
Results - System Development Challenges (In General)
Results - Which Steps are Systems Coupled Across?

Question: To what extent do distinct software modules depend on each other?
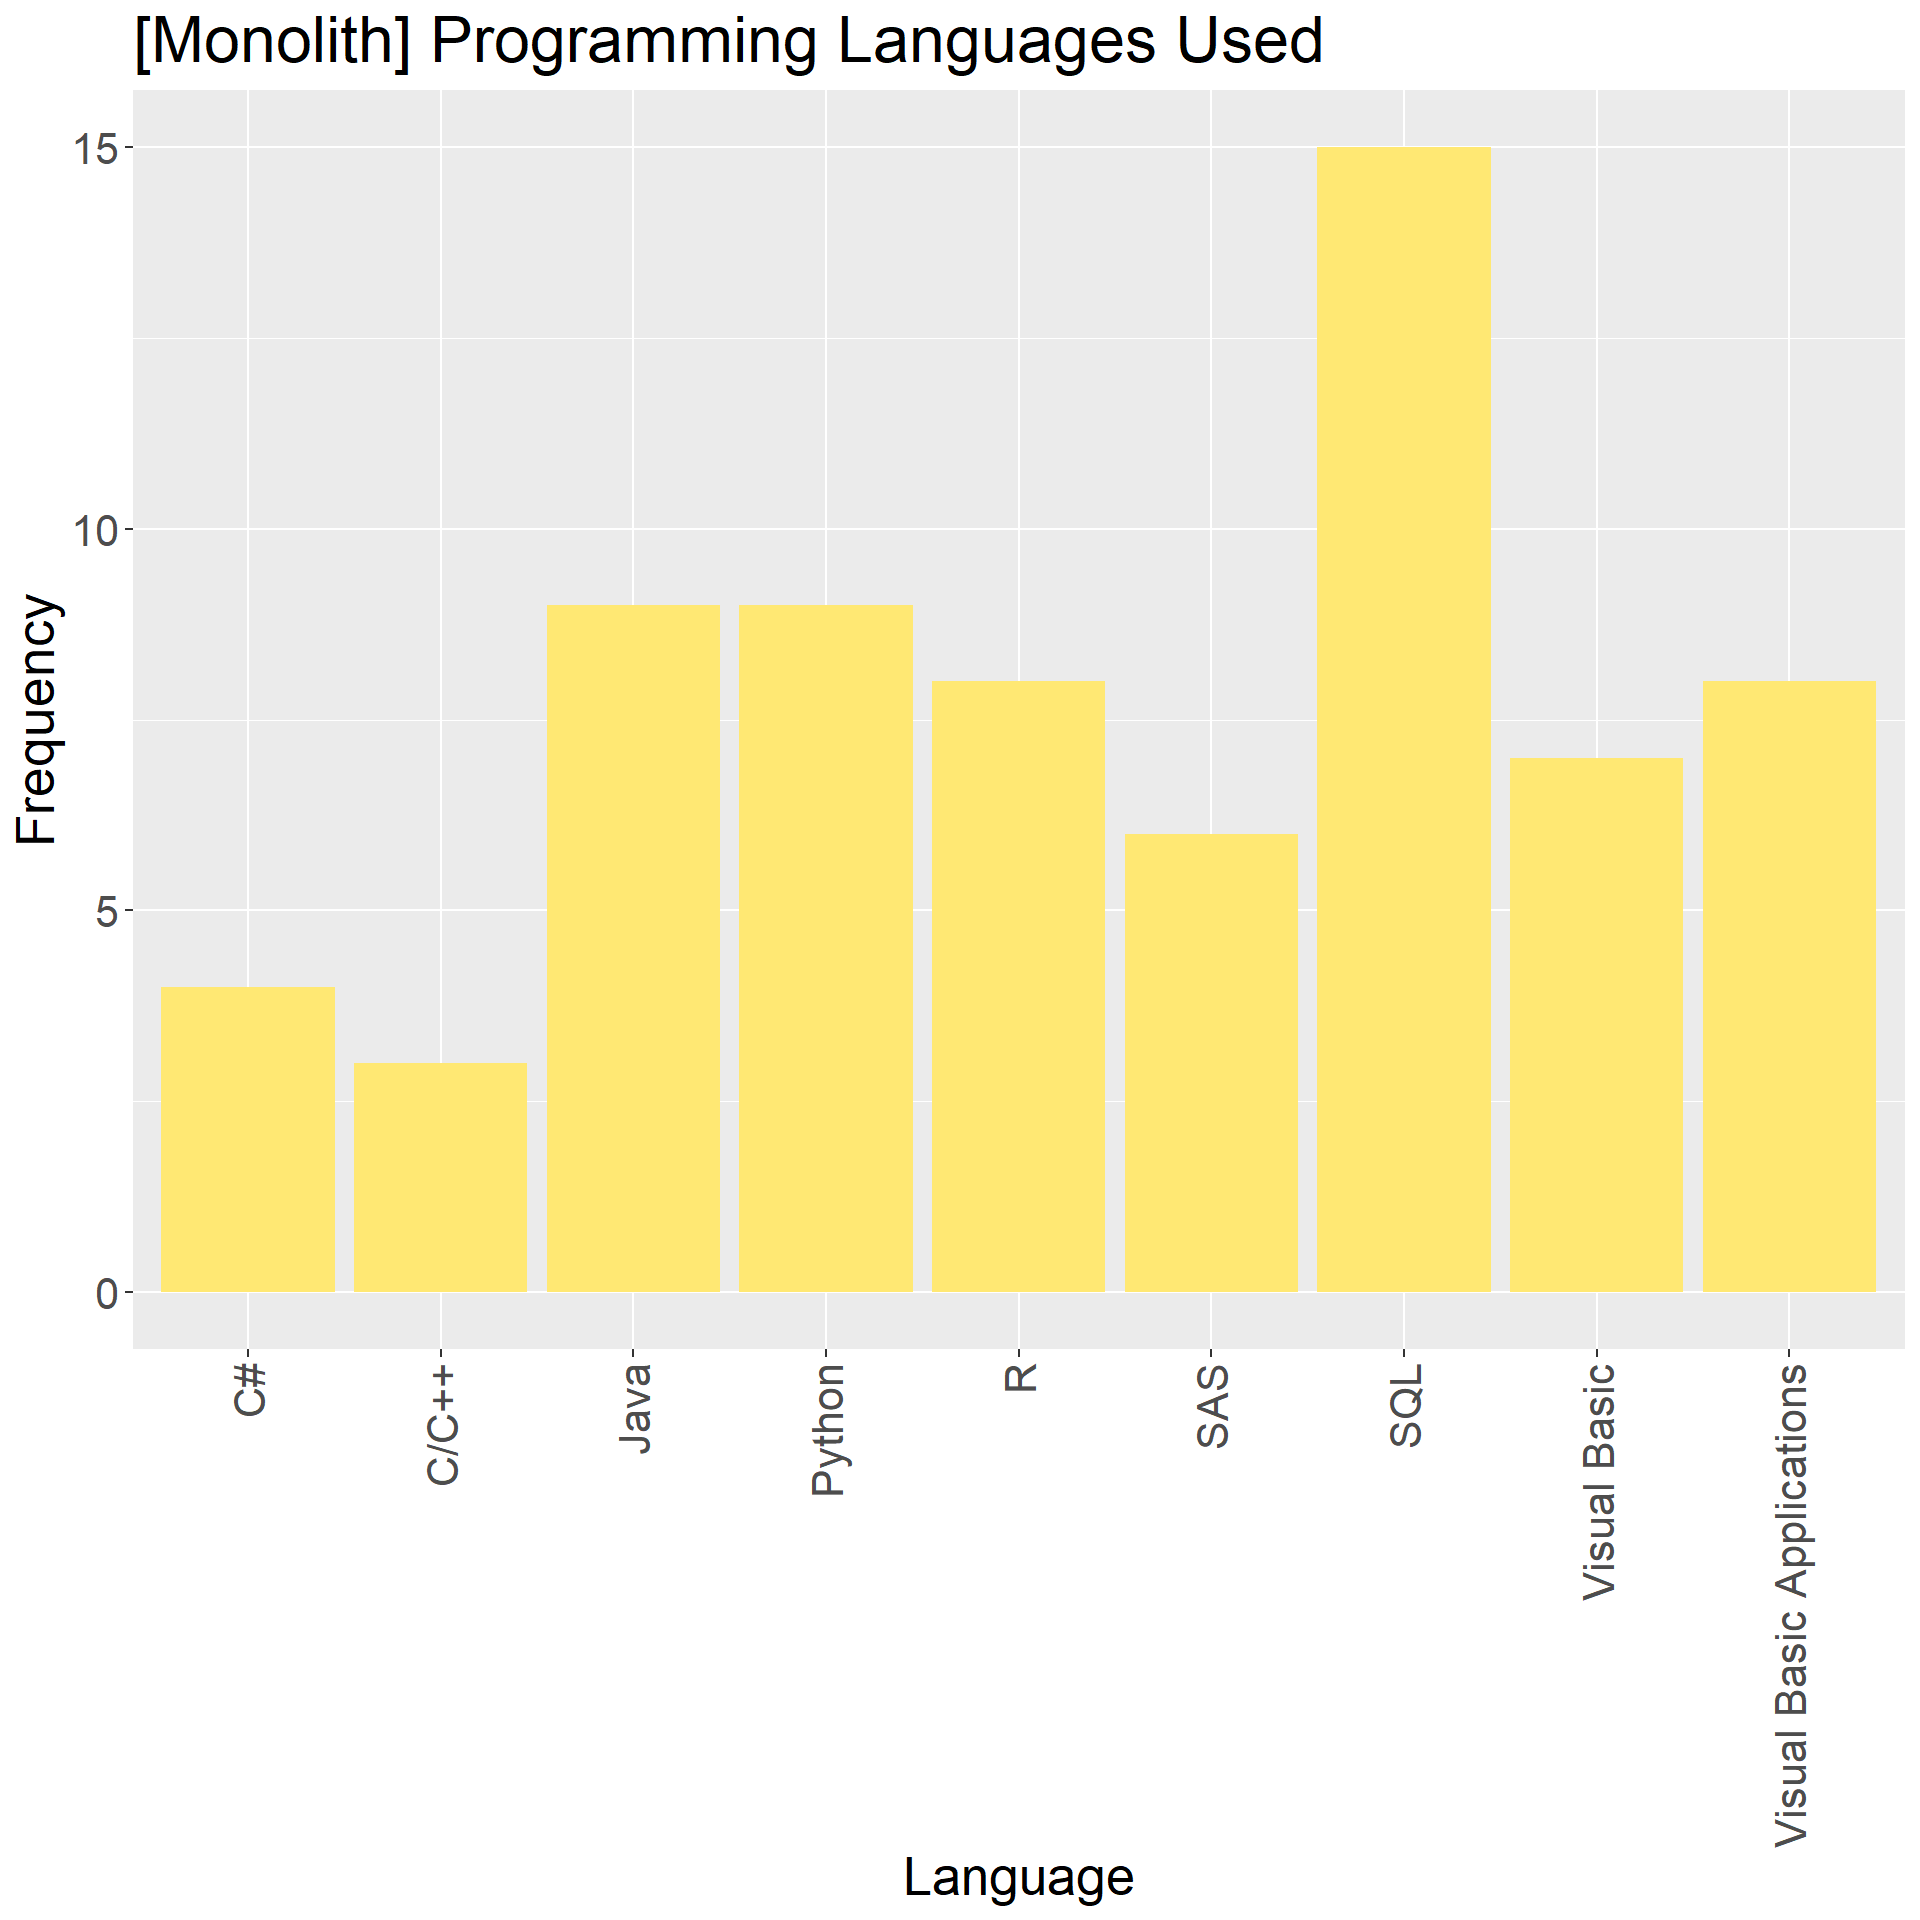
Results - Programming Language Use (Monolith vs. Modular)
Results - System Age (Monolith vs. Modular)
Results - Update Frequency (Monolith vs. Modular)
Results - Update Frequency (4 Team Types)
Results - Lead Time (Monolith vs. Modular)
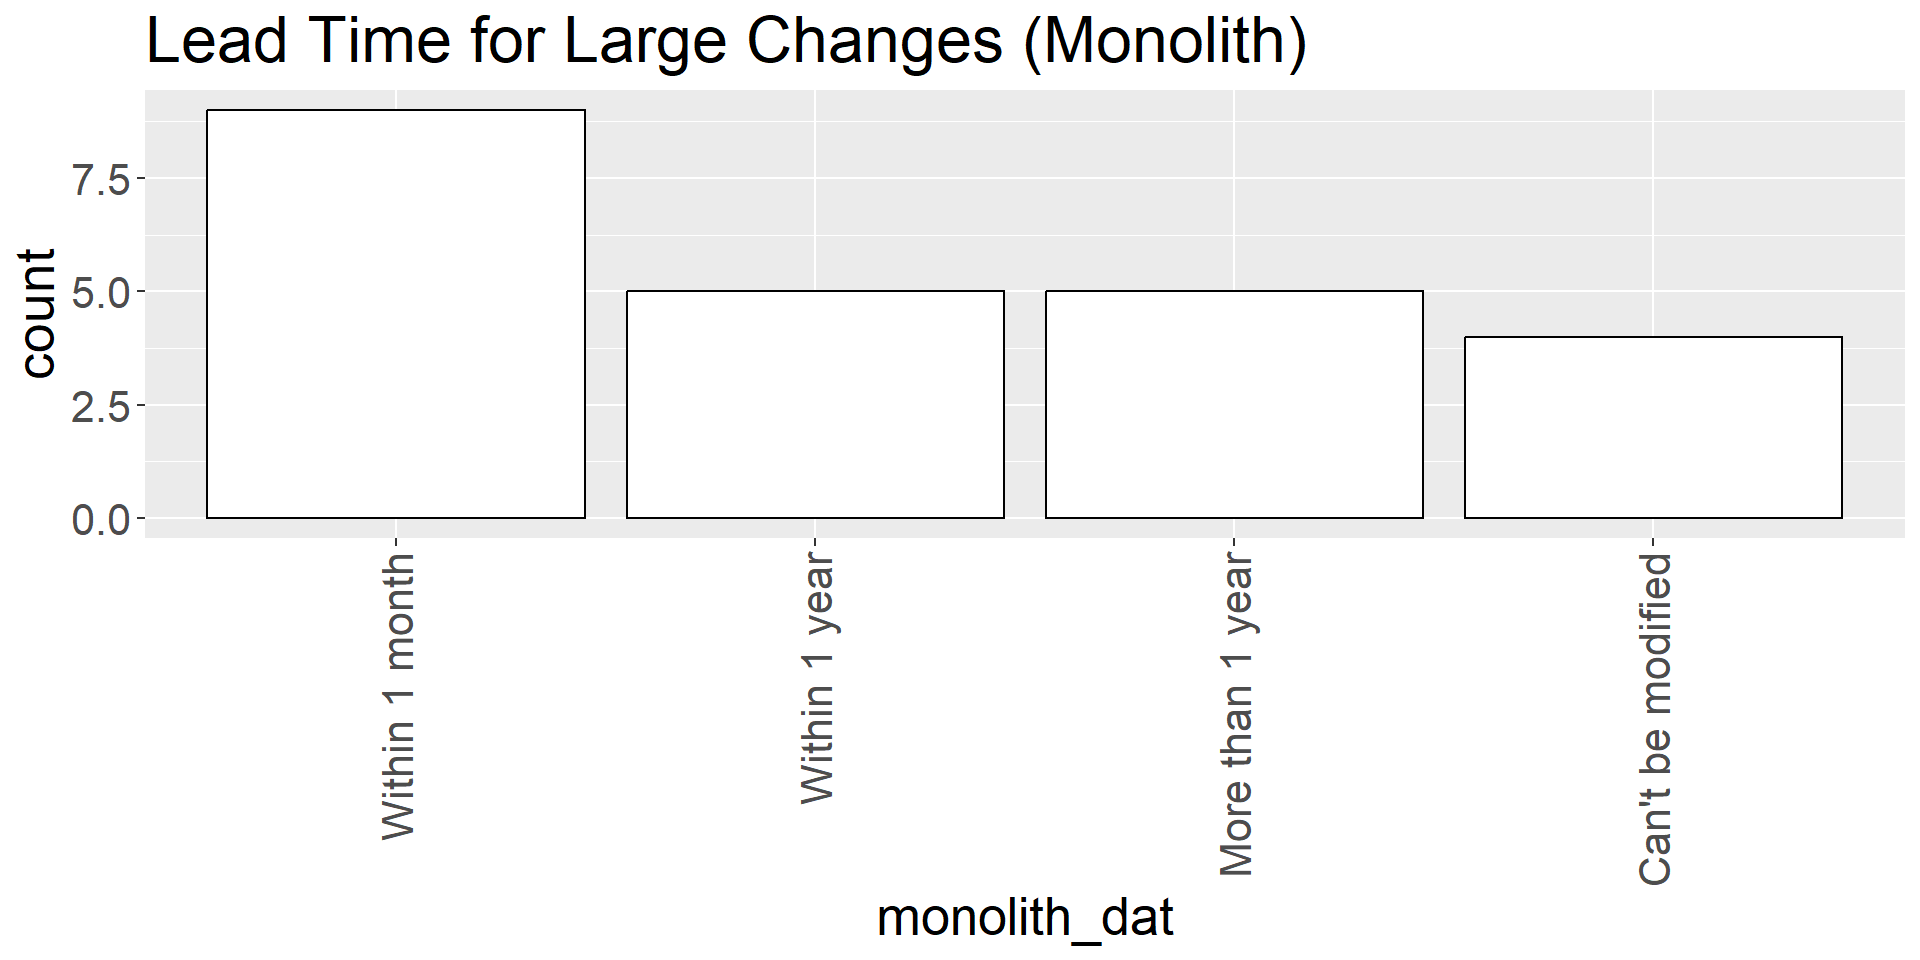
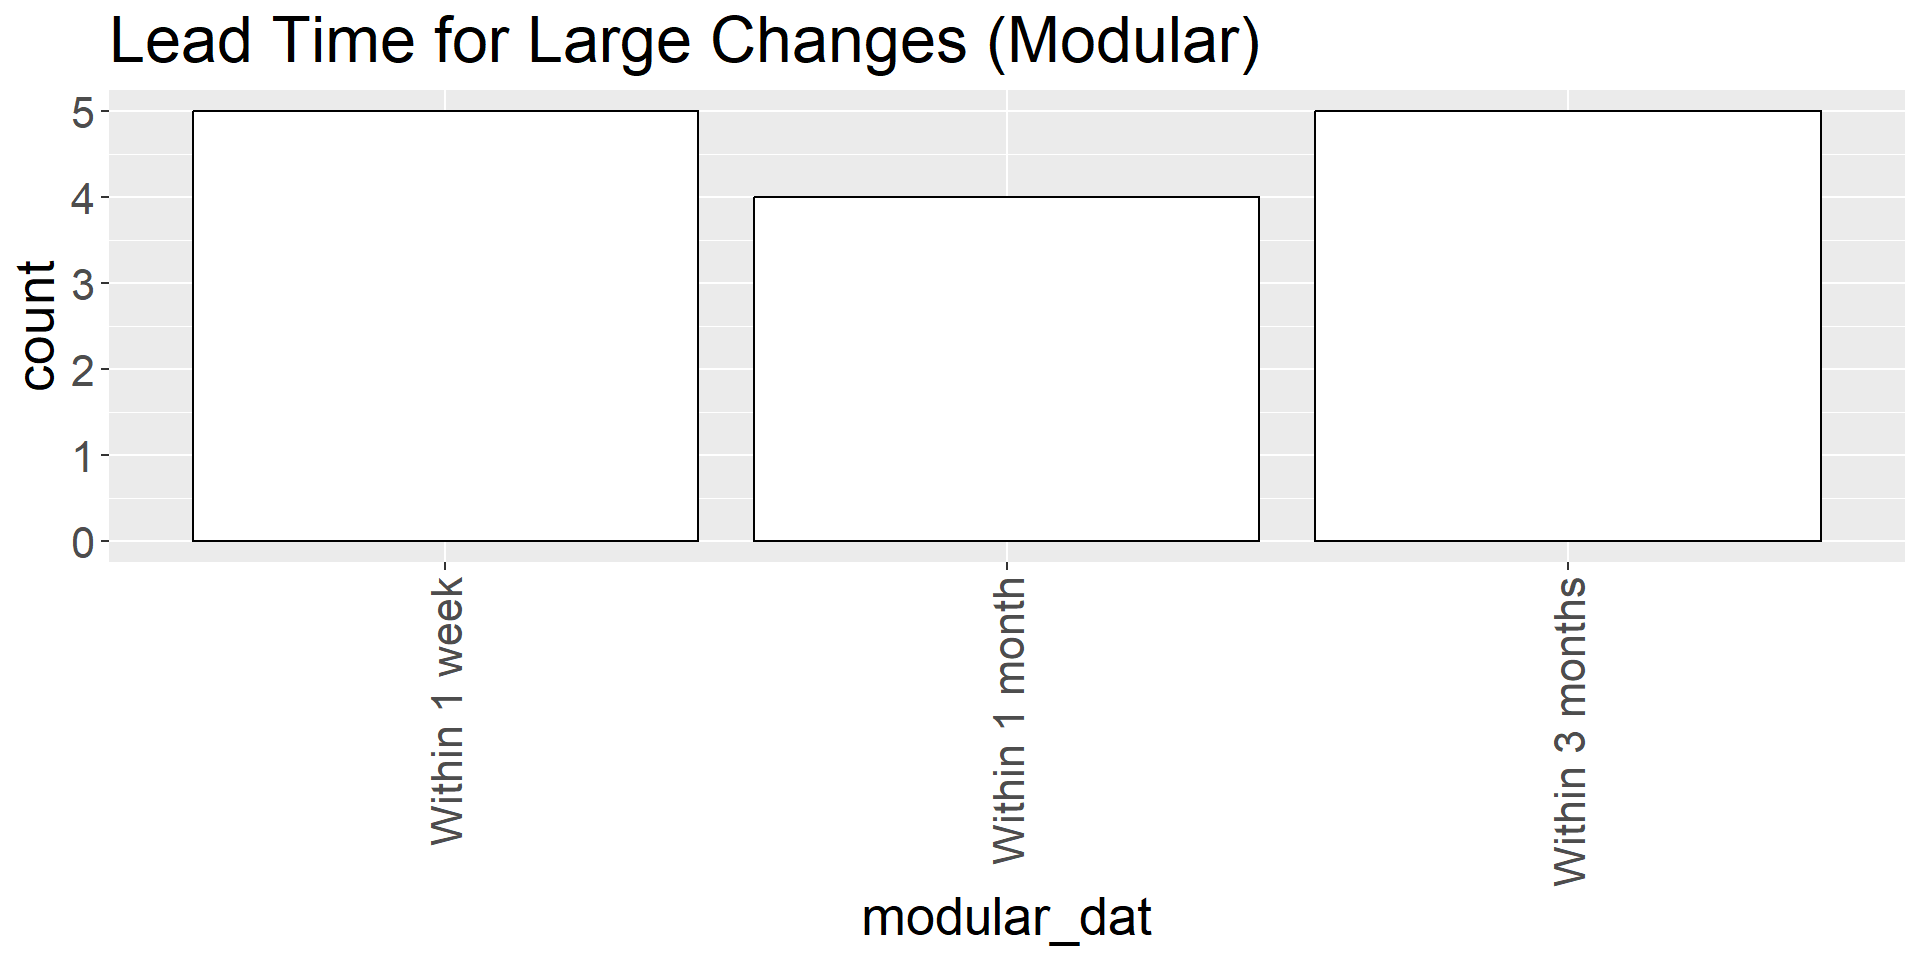
Monolithic systems more likely to report
Within 1 yearorMore than 1 yearfor large changes compared to modular systems.Modular systems never reported
Can't be modifiedorToo complexfor the large changes lead time question, whereas Monolithic systems reported one of these values 4 times.
Results - Lead Time (4 Team Types)
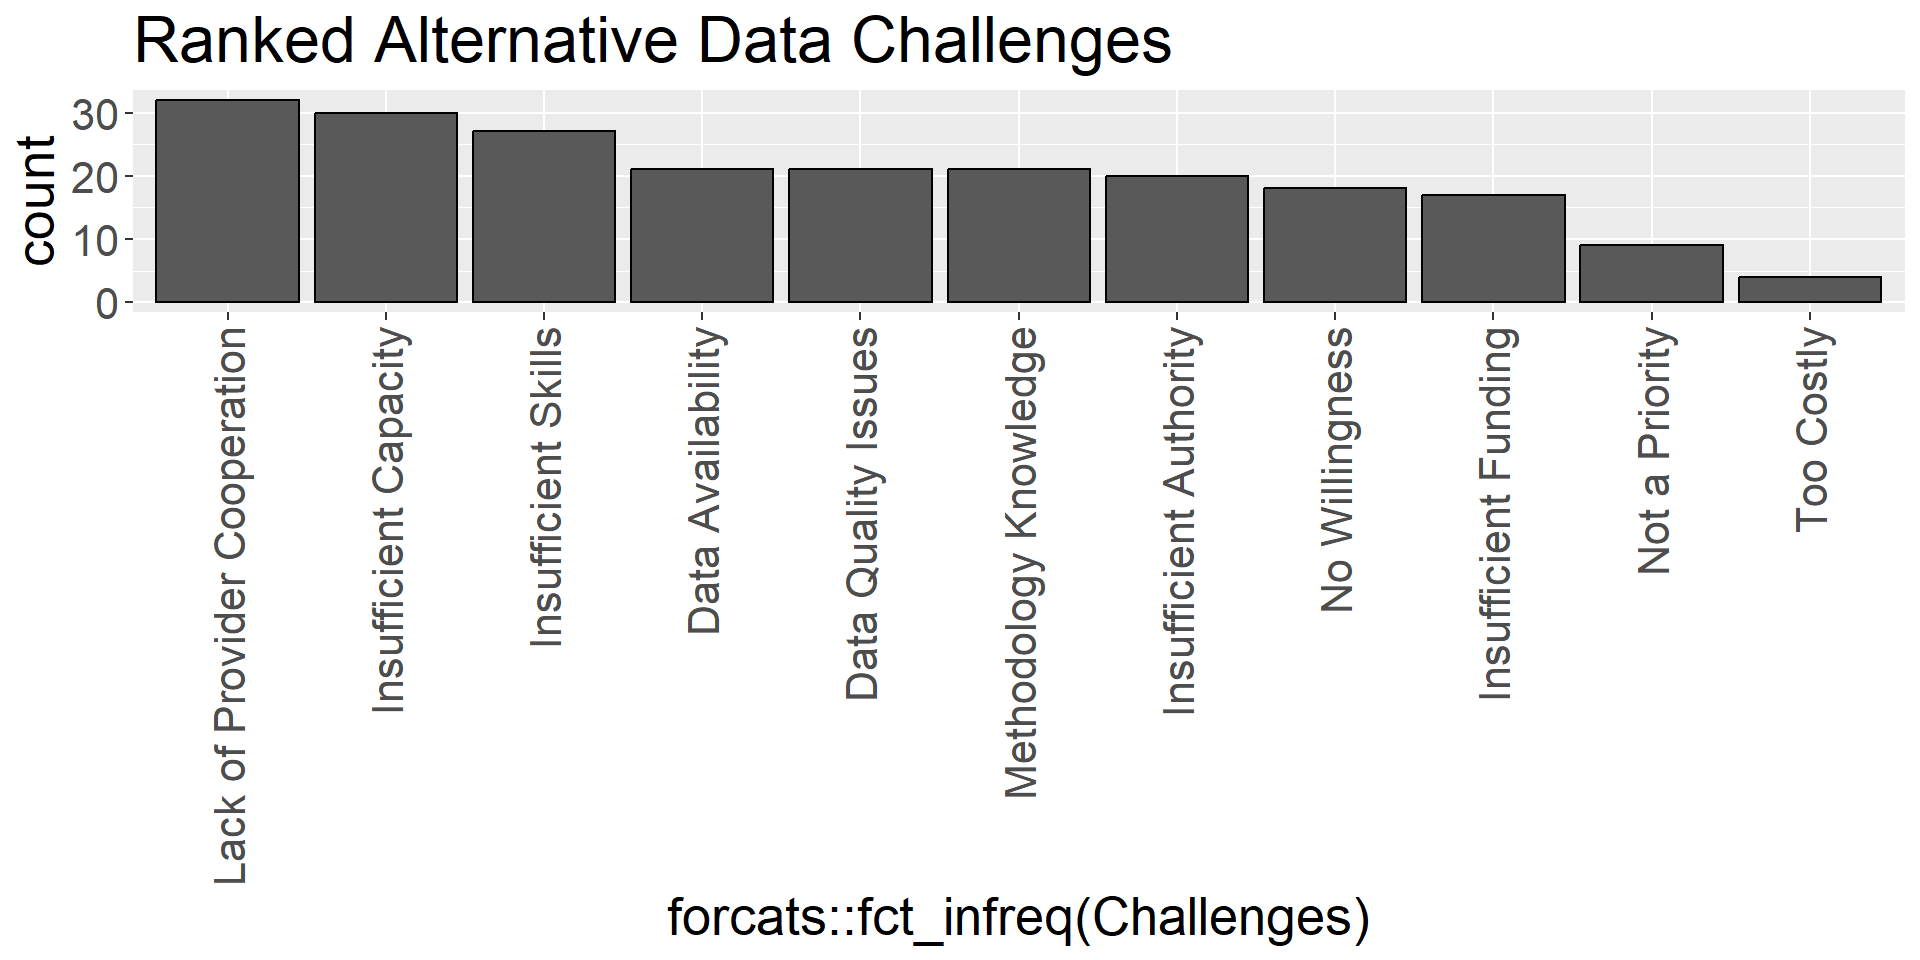
Results - Challenges in Using ADS